Facebook Ads Analytics: All Your Metrics in One Report

So you have created Facebook ad campaigns, and now you’re wondering where to find all your key campaign Facebook ads analytics data. While you can record this data manually, it can become extremely time-consuming and take away from precious time to create, brainstorm, or improve your strategy.
That’s where Metricool comes in, to provide in-depth data on the performance of your Facebook ads campaigns into one comprehensive report. This will help you:
✅ Consolidate information: Access all of your ad performance data in one report.
✅ Saving time and energy: Presenting a social media report to clients has never been easier.
✅ Compare campaigns: In a unique table, see the performance independently or group them as needed for any metric.
Facebook Ads Metrics with Metricool
The metrics that were missing are finally here, the day has arrived! But before we get started we have an IMPORTANT NOTICE. If you manage several clients’ Facebook accounts, it’s important to use separate Facebook Ad accounts for each client.
💡 Let Facebook Ads do the work for you!
Use different and independent Facebook Ads accounts for each client. This way, each account will learn the behavior of one specific client, the ad’s performance, and the followers’ response.
Facebook recommends this option as optimal. Why? Because Facebook Ads learn automatically from your own clients. This way, it can improve the efficiency of your ads in the long term.
If you didn’t set it up this way we highly recommend you change it as soon as possible. All your efforts will be diminished if you mix different client’s accounts and also, all the data will be blended. Facebook Ads won’t be able to optimize your campaigns and it will make it more difficult to improve.
How to connect Facebook Ads with Metricool
▶️ Connect Metricool: To use this feature, connect your Facebook Ads account and click on the three-line icon in the top right corner. Find the “Connections” section and here you can add your Facebook ads account.
▶️ Separate Facebook Ads accounts for each client: If you have multiple profiles in one account then you will have to cross-reference one by one. As we mentioned before, this is the best option to obtain better performance for your campaigns.
Which Facebook Ads Metrics We Offer
To find your Facebook ads metrics in Metricool, navigate to the Analytics tab and find the Facebook ads section. Here you will see all of your crucial data and list of top-performing campaigns.
Facebook Ads Reach

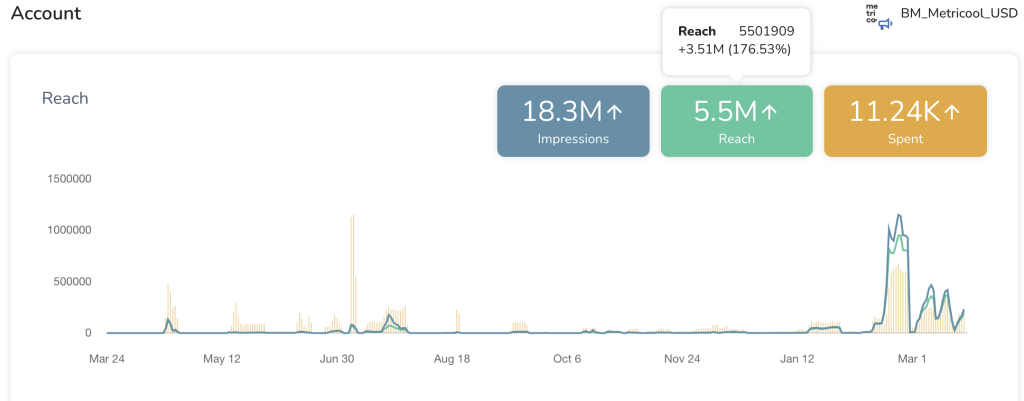
The first graph will show your campaigns’ reach in the analyzed period. This metric is very general but you will get a good overview:
- The yellow bars represent the amount spent.
- The blue line, the impressions.
- The green line, reach.
Impressions will generally appear above the reach line. This is because one ad can be shown several times to the same person.
Facebook Ads Results
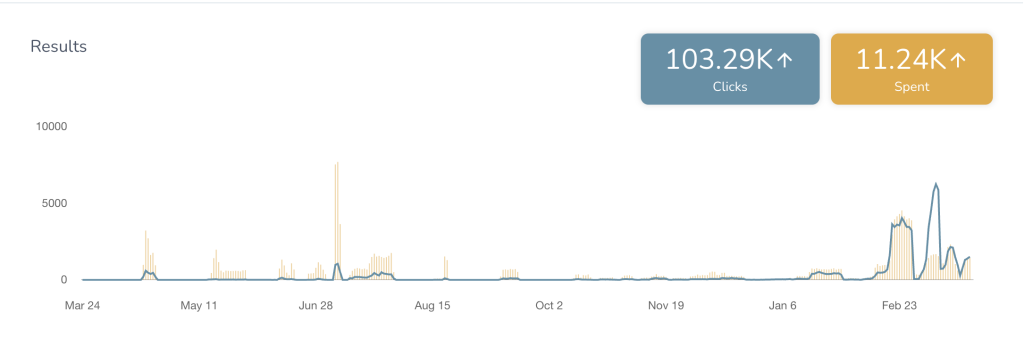
The campaign results will be displayed next, showing a more thorough analysis available for your Facebook Ads. As in the previous graphic, the yellow bars show the money spent on the campaigns.
- Clicks: The blue line in the graph. This data shows the number of clicks that an ad has received.
Remember that to measure conversions properly you must implement Facebook pixel on your website.

Facebook Ads Performance
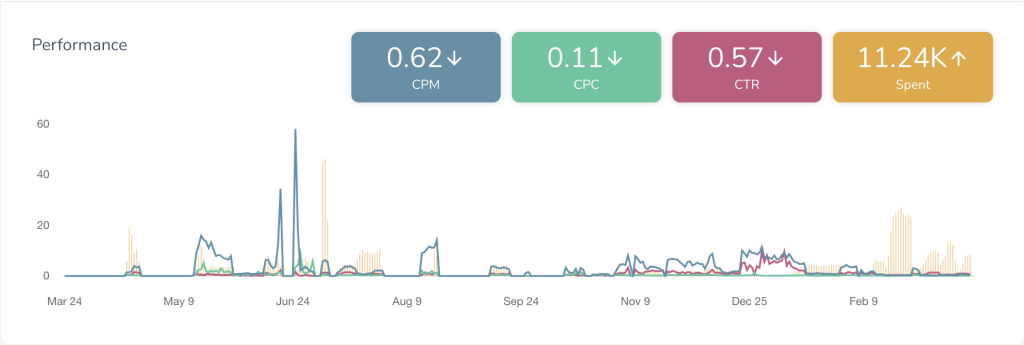
Now it’s time to measure the performance of your investment. How much does a click cost? How much is it to get impressions from one thousand people?

- CPM: Cost per 1,000 impressions, represented by the blue line in the graph.
- CPC: Cost per Click, the green line in the graph.
- CTR: Click-through rate. This is calculated by taking Link Clicks / Impressions. This percentage will help you to know how effective your campaign is. The higher the CTR, the better the result of your ads on Facebook will be. This is represented by the pink line.
💡 How much is a click?
Don’t obsess with the cost per click. Depending on the value of the product sold, a high cost per click can be a good sign. Always think about what you’re selling and the benefits obtained.
Facebook Ads Reports with Metricool
Now that you have all of your Facebook ads analytics in one place, we have one last secret that will be key to your monthly reporting. We are here to make your work and life on social media a bit easier. That’s our objective.
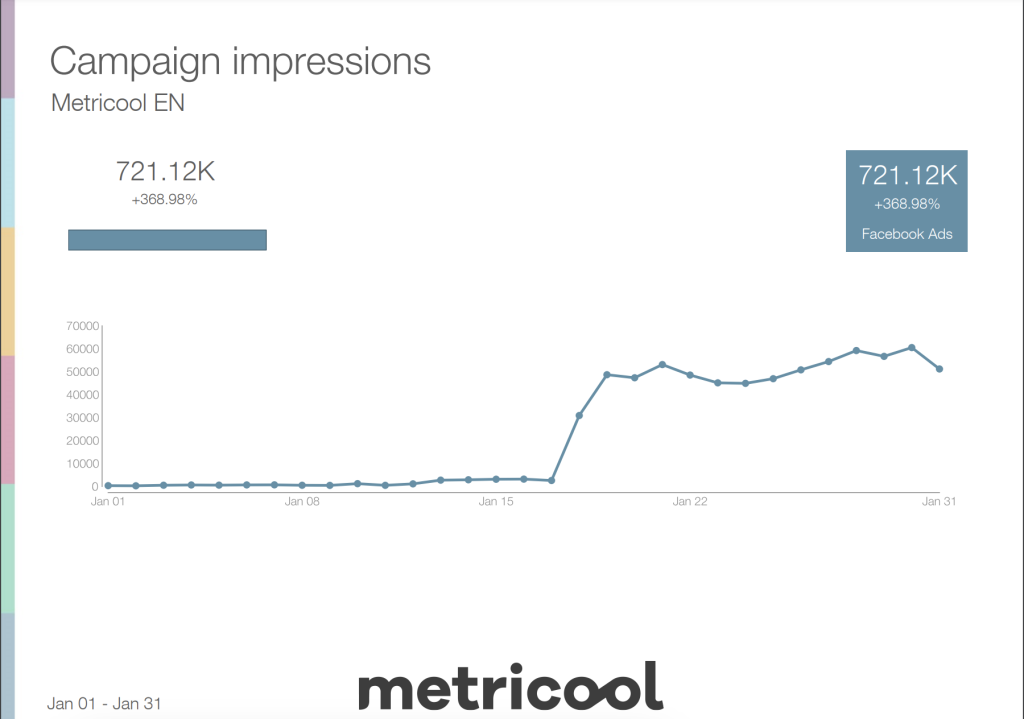
When creating a social media report for your client, you normally include analytics such as engagement, conversions, reach, etc. If you run Facebook ads campaigns, including the performance of your campaigns will justify the effectiveness of advertising campaigns to your client or brand.
Obtaining this data manually can be tedious work. So, this is why you can generate Facebook Ads reports in Metricool by simply selecting the period, language, logo, and metrics to include. Then download in PDF or PPT and voila!

Have all of the necessary data about your Facebook ad campaigns in one place, automated for you.

