Social Media Report: How to Track and Present Your Results
 Anniston Ward
23 June 2025
Anniston Ward
23 June 2025 
At the end of a busy month of posting, commenting, and running ads, it’s easy to lose sight of what all that effort actually achieved. A good social media report takes all your data and turns it into something your team can use to plan smarter campaigns, test new ideas, and focus on what’s actually driving results. It’s how you turn daily activity into long-term strategy.
In this guide, you’ll learn how to build reports that go beyond the numbers to help you figure out what’s worth repeating, where to adjust your strategy, and how Metricool’s automated reporting tool makes the process faster and much more efficient.
What Is a Social Media Report?
A social media report is a document that sums up how your content and platforms performed over a specific time frame. It can include organic and paid metrics, platform-specific data, content performance, audience insights, and more. But the best reports aren’t only about the numbers. They tell a story.
That story helps your team, clients, or managers understand what’s driving results and where to go next.
Why Social Media Reports Matter
A well-done report isn’t just a bunch of numbers. It shows the results of your work and points you in the right direction for what to do next. It connects the past, present, and future of your social media marketing strategy in one easy-to-read document.
Here’s what a good social media analytics report can do:
- Show what content or campaigns performed best
- Track progress toward marketing goals
- Give clients or managers clarity about what’s been done (and why)
- Back up your strategy with data
- Identify patterns you can build on (or mistakes to avoid repeating)
- Measure ROI for paid campaigns, including clicks, conversions, and ad spend efficiency
How Often Should You Create a Social Media Report?
This depends on your needs or your client’s. That said, monthly reports tend to hit the sweet spot. They offer a clear snapshot of performance without being overwhelming.
Other options include:
- Weekly or bi-weekly for fast-paced accounts or paid campaigns
- Quarterly for a broader view of seasonal performance
- Annually to review the full picture and guide future planning
Pro tip: If you’re running paid ads, frequent reporting helps you catch underperforming campaigns before they waste your time and budget.
What to Include in a Social Media Analytics Report
To make your report genuinely useful, you’ll want more than a list of metrics. Here’s a breakdown of the most important sections to include:
1. Executive Summary (Start Here)
Always begin with a short summary that highlights the most important takeaways. This helps busy stakeholders quickly get the gist without digging into every graph.
Include:
- Overall performance highlights (growth, engagement, reach, etc.)
- Notable wins or challenges
- A sentence or two summarizing what’s improved and what needs attention
Example: “Instagram Reels drove 60% of all engagement this month, while Facebook reach declined slightly. Our TikTok audience continues to grow steadily, up 8% since last month.”
2. How to Use This Report
Different audiences will read your report with different goals in mind. Let them know how to interpret the content depending on their role.
- Executives and clients can focus on the summary and the big-picture trends.
- Marketing teams should dive into platform-specific data to inform strategy.
- Analysts will want to explore the detailed metrics and deeper performance patterns.
Helping each group understand the report makes sure it’s read properly and put to good use.
3. Your Goals and Strategy
Revisit the goals you set at the start of the reporting period. This keeps your report focused and ties your results back to the bigger picture.
Examples:
- Grow your following by 10%
- Improve engagement with educational content
- Drive more traffic to your latest landing page
- Reduce ad spend while maintaining conversions
Outlining your strategy also makes it easier to measure success and adjust for the next cycle.
4. Core Metrics (Tied to Your Goals)
Choose metrics that reflect your goals. Don’t include every stat just for the sake of it. Focus on the ones that actually matter.
| Goal | Metrics to Track |
| Reach & Awareness | Impressions, reach, profile views |
| Engagement | Likes, comments, shares, saves |
| Website Traffic | Clicks, sessions, referral data |
| Growth | Follower count, demographics |
| Ads | CTR, conversions, CPC, ROAS |
Add graphs or charts to help illustrate trends at a glance.
5. Competitive Benchmarking & Industry Comparison
Put your performance in context by comparing it to others.
- Competitor Analysis: Use social listening or analytics tools to see how you stack up against similar accounts in your niche. This can uncover gaps or opportunities.
- Industry Benchmarks: Are your engagement rates below or above average for your sector? Knowing the standard helps interpret your own numbers more accurately.
Metricool lets you track competitors and industry trends in one place. It’s the perfect tool for this kind of analysis.
6. Sentiment Analysis
Tracking mentions is important, but it’s just one part of the picture. You also need to understand how people feel when they talk about your brand.
Are the comments and mentions positive, negative, or neutral? Sentiment data helps you:
- Monitor brand reputation
- Spot PR issues early
- Understand how your audience feels about campaigns or content
This is especially useful when launching new products, working with influencers, or managing crisis comms.
7. Content Performance (With Pillars & Themes)
Instead of just tracking formats like Reels or carousels, break your content down by topic or theme as well.
Content pillars can include:
- Educational content
- Product-focused posts
- Behind-the-scenes
- User-generated content
- Entertaining or meme-based posts
Tracking performance by theme helps you double down on what your audience actually wants to see.
8. Platform-Specific Insights
Each social media platform has its own audience, pace, and performance behavior. Your report should look at each one individually.
Questions to explore:
- What worked best on each channel?
- Where is growth happening fastest?
- Which platform is best for engagement? Website clicks? Awareness?
Instead of applying the same strategy to every channel, use this section to fine-tune your approach for each one.
9. Trend and Pattern Analysis
Zoom out to identify longer-term shifts. Looking at month-over-month or quarter-over-quarter trends helps spot what’s gaining momentum and what’s falling off.
As yourself:
- Are engagement rates improving month over month?
- Is your audience shifting platforms?
- Which formats are fading or taking off?
Highlighting trends helps you make smarter decisions about where to focus your time and budget going forward.
10. Brand Consistency Check
Use your report to audit how your brand shows up across platforms.
- Are your visuals, voice, and message consistent?
- Is there a clear thread that connects your content across Instagram, TikTok, LinkedIn, etc.?
Consistent branding builds familiarity and trust, which pays off over time with higher engagement and stronger audience loyalty.
11. Recommendations and Actionable Insights
Turn your findings into actions. For each section of your report, add one or two clear, practical suggestions based on what the data is telling you.
Examples:
- “Increase Reels output to 3x/week based on strong performance this month”
- “Reallocate Facebook ad spend to Instagram, where CPC is 40% lower”
- “Test more product-led content based on high CTR from educational posts”
Use a final section to highlight quick wins or ideas for testing in the next cycle.
12. Tell a Story with the Data
Numbers are powerful, but they need context. Walk the reader through what the data means and why it matters.
Always explain:
- What happened
- Why it happened
- What you’ll do about it
Adding this narrative helps others connect the dots and makes your insights easier to understand and remember.
Common Reporting Mistakes to Avoid in Social Media Reports
Keep these pitfalls in mind when building your reports:
- Cherry-picking data: Highlighting only the positive results might make your work look good on the surface, but it doesn’t tell the full story. Being honest about what didn’t work helps you learn and improve your strategy.
- Too much data, not enough insight: It’s tempting to include every number you can find, but a report packed with metrics can be overwhelming. Instead, focus on the metrics that align with your goals and explain what those numbers mean.
- Skipping the summary: Not everyone who reads your report has time to go through every detail. A clear, concise summary at the start helps busy stakeholders quickly understand the main takeaways.
- Not tailoring the report to your audience: Different people use reports differently. Executives usually want to see the overall progress and key results, while marketers and analysts want deeper details to adjust campaigns and strategies. Customize your report sections to fit their needs.
Avoiding these mistakes makes your report clearer and more useful for everyone.
Build Your Report with Metricool in Minutes
Manually gathering data from every platform can eat up hours. Instead, use a tool like Metricool to generate automated reports in just a few clicks.
With Metricool, you can create customized reports that pull data from multiple platforms into one clean, professional layout. It’s fast, easy to use, and ideal for client presentations or internal reviews.
How Metricool’s Social Media Report Generator Works
- Connect your social media accounts and let the tool collect the data.
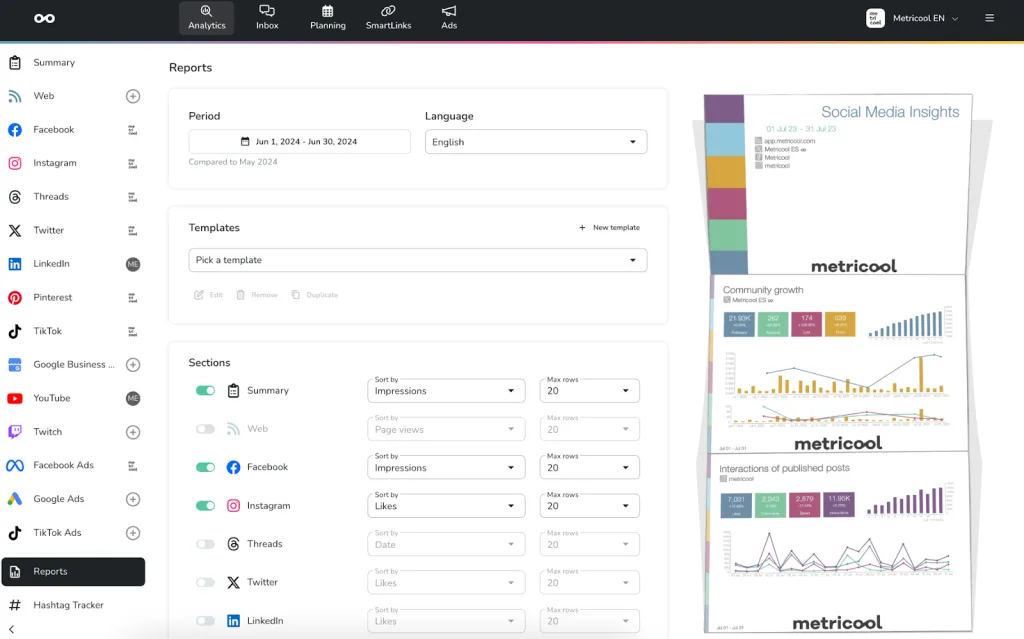
- Go to the Analytics dashboard and click on the Reports tab.
- Choose the time frame, language, and social platforms to include.
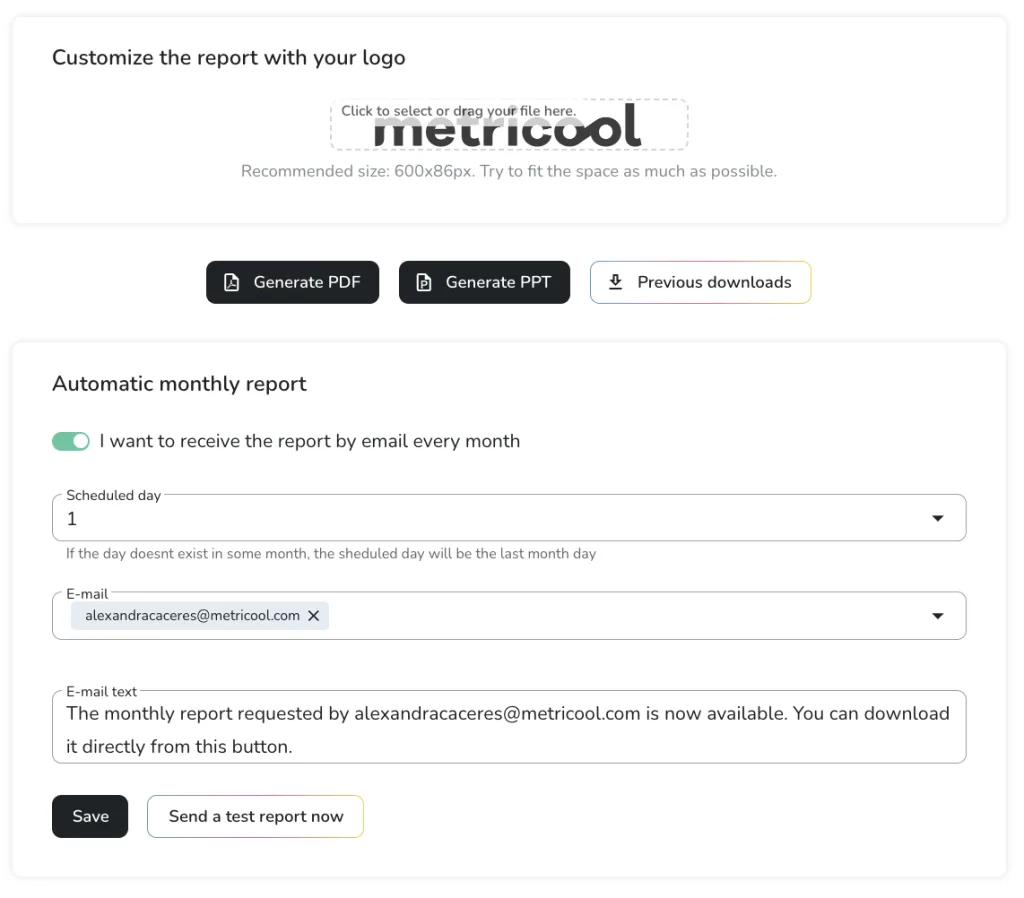
- Upload a logo and adjust the layout to match your brand or client’s style.
- Select whether you want the report in PDF or PowerPoint format.
- Schedule the report to be sent automatically. Monthly, quarterly, or whenever you choose.
Metricool pulls your performance data from all connected platforms automatically. You’ll get a polished, professional report in minutes without needing to open a spreadsheet.
Premium Features:
Social media reporting is a Premium feature on Metricool. All Premium plans include branded logos, while Advanced/Enterprise plans unlock even more customization like branded templates, layout editing, and the ability to choose which metrics appear.
- Custom branding (logos, colors)
- Editable layouts
- Choose specific metrics and sections
- Automatically email reports to clients or teams
- Save and access your last 10 downloaded reports
Why Use Metricool for Automated Social Media Reports?
Here’s what sets Metricool apart when it comes to social media reporting:
- Time-saving: No need to collect data manually
- Fast turnaround: Reports ready in under 5 minutes
- Custom options: Choose your time range, branding, and format
- Scheduled delivery: Set up recurring monthly reports to go out automatically
- Professional design: Clean visuals, easy-to-understand graphs and charts
- Multi-platform: One report for all your connected networks
Bonus: Free Social Media Analytics Report Template
Just getting started? Grab our free social media analytics reporting template to organize your social media data in a clean, easy-to-follow format. It’s perfect for quick snapshots or internal updates.
Social Media Reporting Made Easy
A good social media report does more than show what happened. It helps you decide what to do next. When you include strategy, competitive benchmarks, platform insights, and clear recommendations, your reports become a tool for real progress.
And with Metricool, you don’t need to spend hours pulling screenshots and piecing everything together. Just connect your accounts, customize the layout, and share it with your team or client.
