2024 X/Twitter Study: Data,Trends, and Best Practices to Grow on X in 2025
 Isabel Romero
16 October 2024
Isabel Romero
16 October 2024 The guide to understand X, the microblogging social network, for professionals. Investigate the trends and conclusions after analyzing 23,561 accounts, 2,144,853 posts, and 31,066 threads here.
This study answers how to grow on Twitter/X, with the essential metrics in hand. Data to uncover the keys and evolution of X for social media managers, brands, agencies, and content creators.
- What is the average weekly posting frequency?
- Does posting frequency influence impressions?
- What is the best time to post on X?
Examine the full data and information, in an infographic format, to analyze, compare, and draw your own conclusions about the evolution of X/Twitter in 2024.
What is the ideal posting frequency?
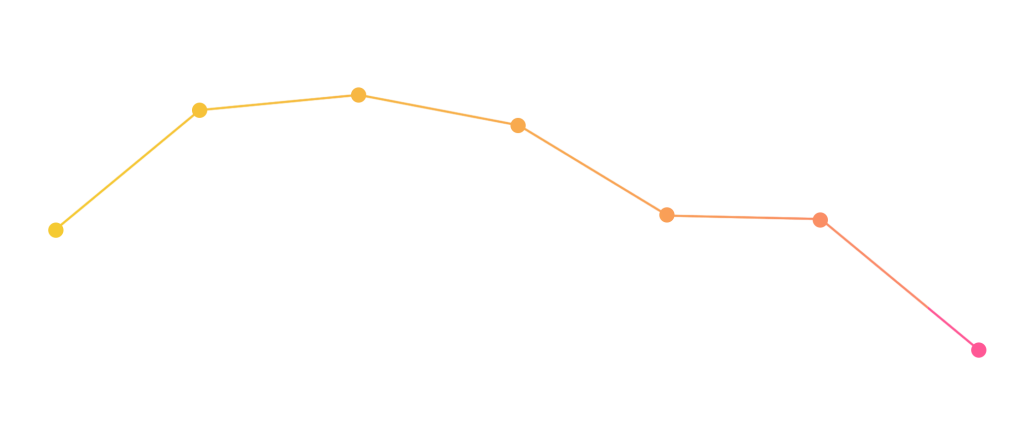
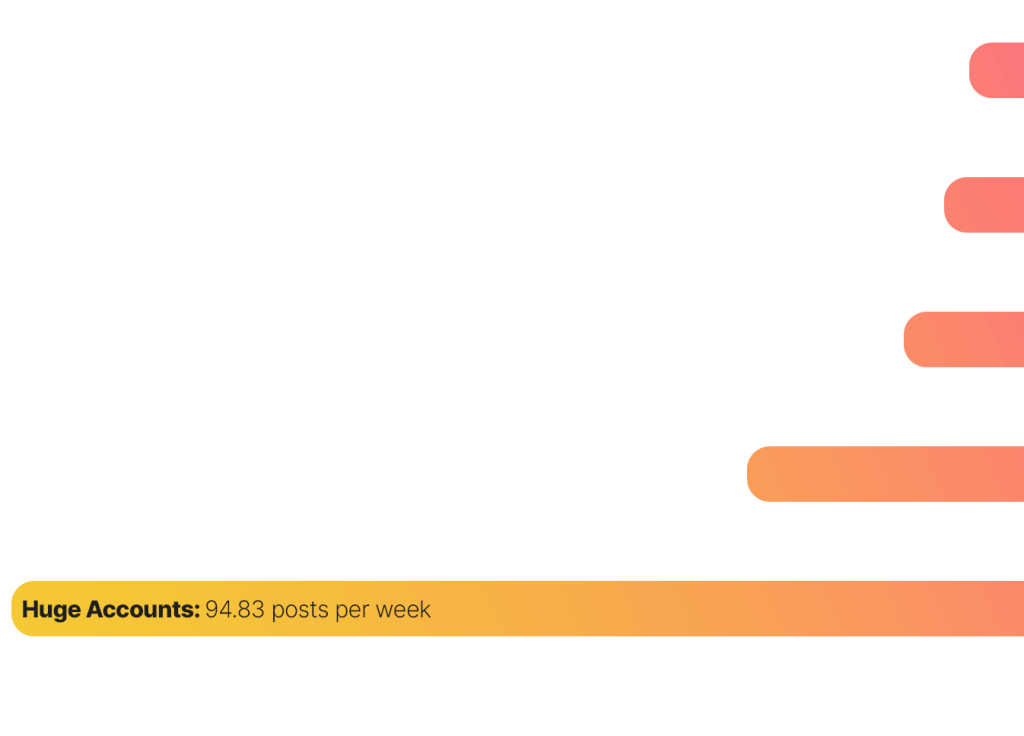
The average global posting frequency on X is 12 posts per week.
However, if we zoom in on the data by account size, the accounts with the most followers post the most per week. With an average of almost 95 posts weekly, they break away from the others.
Do you want to keep up with the largest accounts? The data indicates that the higher the posting frequency, the larger the account size, so increasing your posting frequency could positively impact your follower growth.
Our recommendation is to compare your data against accounts with similar following. This way, you can directly reference the ideal weekly posting frequency.
Now, if you post more, does that mean you will stand out more?
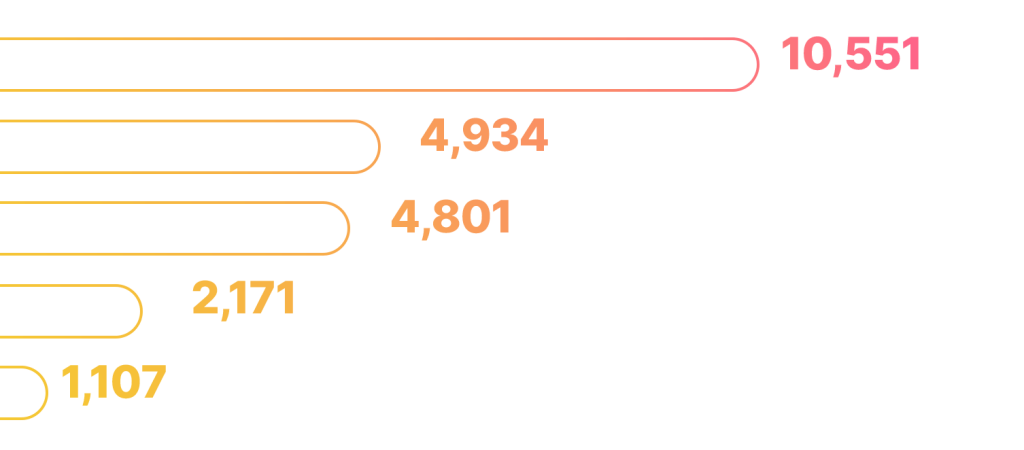
Posting more increases your chances of receiving more impressions, through reaching new users and boosting our brand awareness on X. In fact, the accounts with the highest number of followers gain the highest average number of impressions.
However, it’s not the only determining factor. The content you share within each post determines the number of impressions generated. The higher the content value, the greater the chances of success.
Does posting frequency influence interactions?
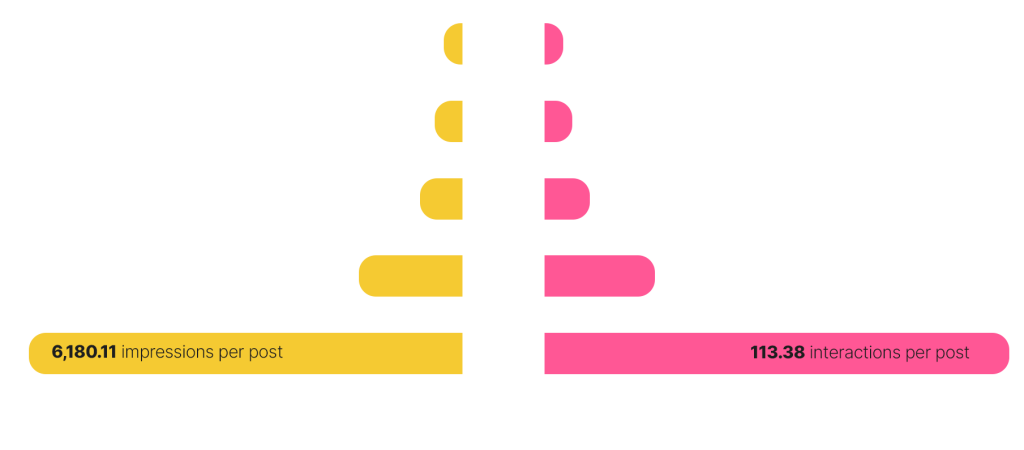
The posting frequency rate is also reflected in the number of interactions.
If we focus on interactions by account size, the accounts with the most followers receive the highest number of likes, an average of 47.95 per post. This coincides with reposts (11.46 on average), replies (4.69 on average), quotes (1.63 on average), profile clicks (15.11 on average), and link clicks (32.54 on average).
How do users interact on X?
X users have a favorite interaction: likes taking first place with an average of 44 “Likes”. Link clicks within a post take second place, while profile visits are the third-most used interaction type.
Reposts, replies, and quotes rank next, respectively. While users like to share their opinions, they prefer to reply than to quote the content.
Therefore, with impressions as the key metric, you can stand out on X, while also generating quality interactions with your content. Remember that posting frequency is just as important as the value you bring to users.
How do you know if you have a positive engagement rate?
Engagement is a key metric for understanding the degree of user engagement with your content. But, what is a “good” engagement rate on X?
While no one figure indicates “perfect” engagement, the answer lies in comparison to the previous study, which will confirm if engagement has increased or decreased.
A good place to start is to compare your engagement rate with similarly sized accounts to see if you’re achieving the average results.
| Tiny Account | 2.21% engagement rate |
| Small Account | 1.3% engagement rate |
| Medium Account | 1.83% engagement rate |
| Big Account | 1.81% engagement rate |
| Huge Account | 1.83% engagement rate |
Threads or long-form posts?
The data proves that accounts prefer long texts (25,000 characters) over threads. The sample found an average of 44.87 long posts versus an average of 15.28 threads.

The answer is clear when analyzing the number of threads and long posts per week by account size. Accounts with the highest number of followers post the most long-form posts and share the most threads.
Remember to use this data to compare your account according to the number of followers
To compare, we have collected information from verified accounts, those that have access to long-form posts.
What is the best time to post on X?
The time of day with the highest average connected users is 9 p.m., globally. Wednesday is the best day to post followed by Tuesday and Thursday.
We group the time zones to extract global data, so it doesn’t matter where you reside to compare this data.
Now it’s your turn to get into research mode! Download the 2024 X Study infographic and start drawing your own conclusions – it’s only a click away!