2024 Facebook Ads Study: Analysis and Trends for Meta Ad Campaigns

Through the data extracted in our Facebook Ads Study, we wanted to provide answers to the biggest questions that brands, agencies, and social media managers think about when preparing their advertising strategy.
- What campaign is most-used by brands and social media managers?
- What campaign type generates the most impressions?
- Which campaign sees the highest investment?
- What is the average Cost per Click (CPC)?
- Which country has the highest CPC?
- Are there any changes compared to the 2023 Study?
This is just the beginning. With the 2024 Facebook Ads Study in hand, you can feel confident in strategizing your next campaign.
Facebook Ads 2024 Trends
The study contains importation conclusions for brands and social media managers looking to optimize their Meta advertising campaigns.
For example, the most-used campaign type. This is one of the most sought-after questions, in which we can conclude Engagament campaigns stand out by far, consisting of 42.4%. Following behind are Traffic campaigns which make up 32.6% of the total campaigns evaluated.
Another data point that raises curiosity when creating Facebook Ads campaigns is how much money is invested, and which campaign types see higher investments. The result may surprise you, because those ads dedicated to App Promotion have the highest investment per campaign, for an average of $1856.64.
This isn’t the only data where this campaign stand out. App Promotion campaigns also have the highest Cost per Click (CPC), towering well above Traffic campaigns at just $0.04.

Evolution of Facebook Ads in 2024
So, how have Meta ads evolved in respect to the lat year’s Facebook Ads Study?
In reality, we’ve seen few changes over the year. Therefore, we can’t draw any huge revelations between the 2023 Facebook Study and the 2024 Facebook Study, however, we can compare the data to each other to see how brands and social media manager’s behaviors have changed.
For example, App Promotions campaigns once again see the highest average investment, $1856.64, with a decrease in $41.31 compared to 2023.
When looking at the data for the most-used campaigns, it seems that once again, Interaction campaigns lead the ranks, and have grown in use by 0.7% from last year. Traffic campaigns once again take second place, increasing use by 0.5%.
This suggests that brands and social media managers are investing in these campaigns to increase interactions and attract users to a website or landing page.
Facebook Ads Study Data
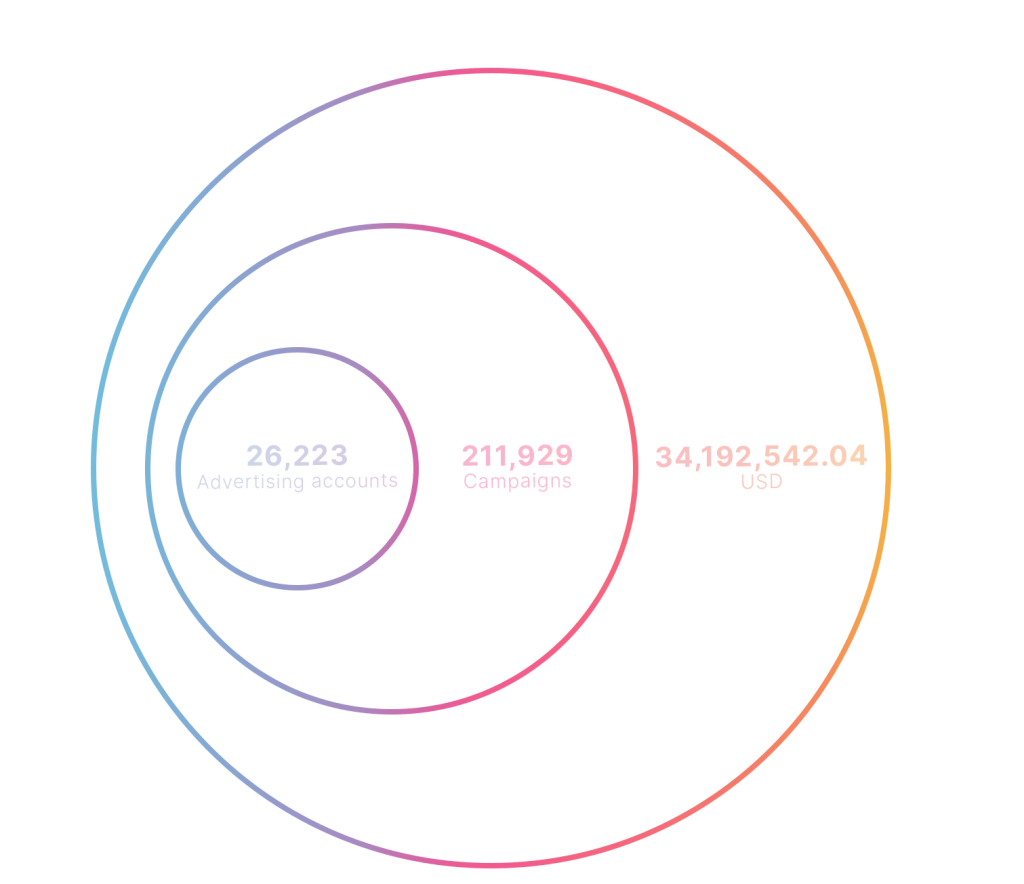
How have we prepared this study? We analyzed 26,233 professional accounts to understand how brands, social media managers, and agencies implement their advertising strategies across Meta placements.
To do this, we took a sample of 211,929 campaigns for a total investment of $34,192,542.045 over 60 days, between January 1 and February 29, 2024.

What do you think of the 2024 Facebook Ads study? Let us know in the comments, and how you are applying this data to your Meta advertising strategy.

