

How to Create Custom X (Twitter) Analytics Reports
 Kalum
16 July 2026
Kalum
16 July 2026 
Content moves at a breakneck speed, where a single post can trend globally within minutes and fade into the background just as quickly. For social media teams, digital agencies, and independent creators, this rapid cycle makes retrospective analysis both incredibly important and notoriously difficult to handle. If you cannot see which conversations are driving real traffic to your business, you are simply shouting into a crowded room and just hoping someone hears you.
To build a sustainable growth strategy, you need to gather your impressions, profile visits, link clicks, follower shifts, and more into a cohesive Twitter analytics report. However, manually compiling these numbers across multiple client accounts often turns into an administrative bottleneck, taking up valuable hours that would be better spent writing copy or building community relationships.
Metricool Studio is a reliable, AI-powered Twitter report tool, allowing you to move from manually static charts to conversational, prompt-driven reporting dashboards. This guide provides a comprehensive path to conquering your platform data, from connecting your profiles safely to utilizing natural language commands to build professional, customized reports.
Why You Might Need Custom X (Twitter) Reports
Different needs depending on your business: Standard, out-of-the-box analytical templates treat every profile the same, whether you are tracking link-in-bio clicks for a local retail shop or a corporate brand monitoring customer service replies. This rigid approach leaves you sorting through generic data points while obscuring the specific answers your stakeholders actually care about. Custom reports allow you to isolate the performance indicators that directly match your immediate business objectives. If your current campaign focuses entirely on building brand authority through multi-post threads, a custom layout lets you strip away irrelevant metrics and place your thread click-through rates and bookmark trends front and center. Tailoring your data view ensures that your clients, internal executives, or brand partners can instantly see the exact commercial value your creative strategies deliver without wading through pages of unformatted numbers.
Make Custom X Reports with Metricool Studio
Metricool Studio is an AI-powered data visualization and reporting workspace built directly into the Metricool interface. Designed to transform complex performance metrics into clear, executive-ready summaries, this specialized engine removes the technical learning curves traditionally associated with custom dashboard creation.
Instead of forcing you to manually configure complex chart axes, build pivot tables, or link disconnected databases, Metricool Studio utilizes an advanced language-processing layer. This allows you to interact with your cross-platform digital metrics using plain language commands.
You simply type out a description of the exact data overview you need, and the system instantly queries your historical records across your connected channels. Within seconds, it builds a cohesive, tailored Analytics View complete with interactive line graphs, comparative data grids, and written text recaps that explain what changed over time and why those movements matter to your business.
How to Safely Connect X (Twitter) to Your Metricool Workspace
Before you can start using a prompt-driven Twitter analytics tool to analyze your performance, you must establish a secure link between your profile and your central management dashboard. Metricool handles accounts using a streamlined “Brand Bundle” structure, allowing you to house one profile for every major digital network under a single client name.
Follow these direct steps to connect your profile and start recording your data history:
- Navigate to Your Profile Connections: Log into your primary Metricool control panel, click your account avatar in the top right corner, and select the specific Brand workspace you want to configure.
- Locate the X / Twitter Integration Option: In the left-hand navigation menu, click on “Connections.” Find the X logo within the social network listing and click the “Connect” button.
- Authorize via Official API Protocols: The system will safely route your browser to the official X application authorization gateway. Enter your corporate profile login details and click “Authorize App.” This official integration ensures that Metricool can securely collect your public performance figures without ever seeing, storing, or compromising your private account password.
How to Create Your First Custom X Analytics Report
With your account securely connected and gathering data, you can build a customized performance dashboard that directly addresses your operational goals. Follow this practical workflow to move from a blank screen to a polished digital asset.
- Open Metricool Studio
- Set your creation parameters: Choose Guided Mode for a premade prompt, or Expert Mode for an open text layout
- Write a precise data prompt for your needs
- Generate and review your asset
Guided Mode vs. Expert Mode: Two Paths to Custom Reports
The application accommodates different operational styles and reporting goals by providing two distinct workflows within the Studio dashboard: Guided Mode and Expert Mode. Both options allow you to move away from generic templates and build a tailored presentation that reflects your unique performance indicators.
Guided Mode
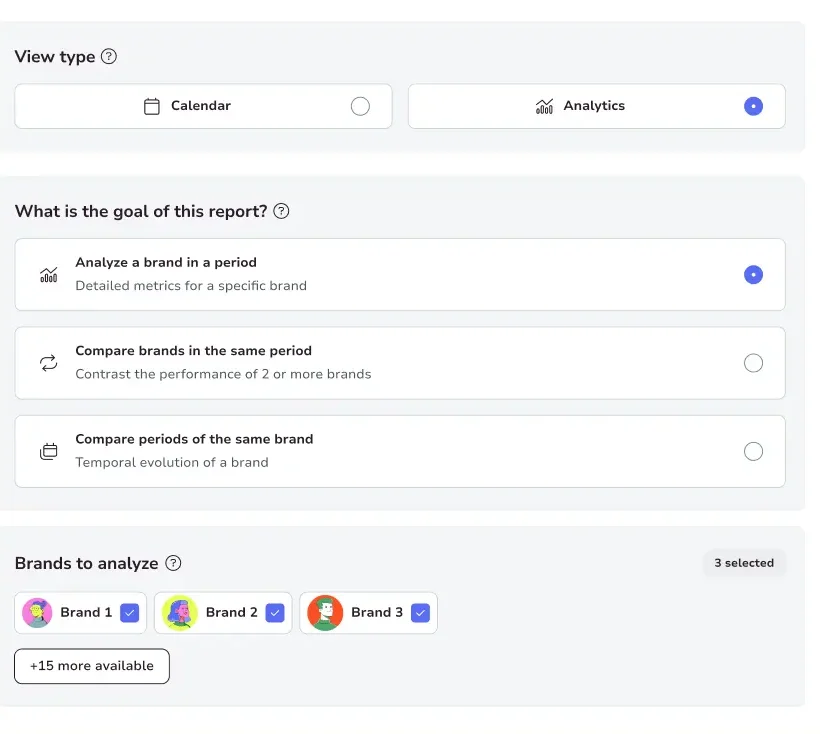
If you prefer a structured, visual creation process without worrying about formulating the perfect text prompt from scratch, Guided Mode offers a reliable framework of drop-down selection fields. The wizard guides you through your setup by asking for specific parameters:
- View Type: Establish whether you require an analytical trend summary or a visual calendar layout.
- Establish parameters: Define Goals, time windows and brands to analyze.
- Social Networks: Select X along with any other complementary digital platforms you want to audit simultaneously.
- Core Performance Metrics: Check the boxes for your top priorities, such as audience growth, community engagement rates, or outbound link click metrics.
Once you make your selections, the platform automatically generates the underlying prompt text on your behalf, ensuring an accurate, well-formatted asset build on your very first click.
Expert Mode
When your marketing team needs to answer highly specific business questions, audit a very niche campaign, or run a deep competitive review, Expert Mode opens up an open-ended text input box. Here, you can talk to your data just as if you were working alongside a professional human marketing analyst.
You can enter complex, custom instructions such as asking the system to isolate every thread published on a weekend that earned an engagement rate above three percent, or requesting a detailed breakdown of how your follower acquisition trends shifted during a specific industry event week.
To save time during busy end-of-month reporting cycles, Expert Mode also includes a library of built-in Smart Templates. These pre-configured prompts provide immediate starting points for essential management tasks, covering areas like competitor benchmarking, optimal publishing time evaluations, and content generation ideas based on your historical top performers.
Key X Metrics to Feature in Your Custom Reports
To ensure your custom reports deliver real commercial value to your marketing team or external corporate sponsors, you must look past basic vanity numbers and focus on metrics that prove true brand engagement and conversion impact. Metricool Studio can track, organize, and interpret several core areas of your account performance:
| X Performance Area | Metric Tracked | Value |
| Content Visibility | Total Impressions | Measures the absolute reach of your messages, indicating how successfully your brand is appearing in user feeds and search queries. |
| Audience Curiosity | Profile Visits | Tracks how many users were intrigued enough by an individual post to click through and view your main brand profile page. |
| Community Interest | Engagement Rate per Post | Calculates the percentage of viewers who actively interacted with your content via likes, reposts, or bookmarks, showing true topic relevance. |
| Outbound Conversion | Link Click Volume | Tracks direct traffic generation, showing how effectively your copy is driving readers away from the social feed and onto your website or e-commerce shop. |
| Conversation Depth | Reply and Mention Volume | Measures two-way community interactions, highlighting how successfully your brand is sparking active discussions within your industry niche. |
| Audience Expansion | Net Follower Growth | Monitors long-term community building, helping you determine if your content is attracting a sustainable, permanent audience over time. |
Customizing, Polishing, and Automating Your Shared Reports
Once Metricool Studio generates your tailored analytical view, the resulting page remains completely flexible and interactive. This ensures that the final product can be customized to match your exact agency workflows and presentation styles.
Editing Your Automated Text Summaries
While the built-in language processor provides highly accurate interpretations of your data trends, you may want to insert personalized internal context before presenting a report to an external client or corporate stakeholder. Every single block of text generated by the AI assistant is fully editable. You can easily click directly into the text boxes to add your own notes, highlight specific sponsorship wins, explain a sudden seasonal dip, or adjust the phrasing to match your company’s internal communication style.
Saving Layouts for Future Use
You do not have to spend time rewriting your detailed analytical prompts every single week or month. When you construct a report configuration that perfectly aligns with your team’s tracking goals, you can save that customized view directly inside your dashboard. When the next review period comes around, simply open your saved view layout, select your new date range from the drop-down menu, and watch the platform automatically refresh every single chart, data grid, and written summary with your latest real-time numbers.
White-Labeling and Professional Exports
When it is time to deliver your performance updates to corporate partners, internal executives, or prospective brand sponsors, the platform provides clean, high-quality export methods. You can instantly download your custom views as beautifully formatted PDF documents or complete PowerPoint slide decks. For advanced account tiers, these files can be completely white-labeled, allowing you to add your own agency logo, apply your unique brand colors, and remove all third-party software watermarks before delivery.
