



The 2024 LinkedIn Study examined 41,170 LinkedIn company pages and a total of 1,578,969 posts over a span of 122 days. The study aimed to answer key questions such as the day of the week with the most engagement, the top-performing post type, and the average number of comments on LinkedIn posts.
We are now delving deeper into the data to provide insights for 19 specific industries or professional sectors analyzed in the 2024 LinkedIn Study. This includes determining the optimal day and time to post for maximum engagement in your industry, evaluating whether your posting frequency is appropriate, and assessing your hashtag usage. Continue reading below to discover more about your industry’s LinkedIn engagement trends.
Industries Analyzed in the 2024 LinkedIn Trends Study
The professional services sector encompasses businesses engaged in providing professional, scientific, and technical services to clients. This includes legal advice and representation, accounting, bookkeeping, and payroll services, architecture, engineering, specialized design services, computer services, consulting services, research services, advertising services, photographic services, translation and interpretation services, veterinary services, and other professional, scientific, and technical services.
Key insights for the professional services industry
Key insights for the professional services industry
Accounts | Posts | Average posts per period | Average posts per week |
|---|---|---|---|
8,863 | 305,750 | 34 | 2 |
Post Type
Carousel | Image | Other | Video |
|---|---|---|---|
3,175 | 8,010 | 6,689 | 4,645 |
Metrics
Average number of clicks | Average number of comments | Average number of impressions | Average number of likes | Average number of shares | Engagement |
|---|---|---|---|---|---|
68.25 | 0.38 | 689.34 | 10.82 | 1.09 | 11.68% |
Hashtags
Total hashtags used | Posts | Average number of hashtags per post |
|---|---|---|
1,472,991 | 305,750 | 4.82 |
Emojis
Posts | Emojis | Average number of emojis per post |
|---|---|---|
305.750 | 813.345 | 2,66 |
Description Word Count
Average word count |
|---|
79.3 |
Posting on LinkedIn in the professional services:
Best day to post on LinkedIn: Tuesday
Best time to post on LinkedIn: 10 am
According to the LinkedIn Study data, which analyzed 305,750 posts in the professional services industry, the most-shared type of post was a single image. On average, brands in this sector posted twice a week and used 4 to 5 hashtags per post. These findings provide valuable guidance for refining your LinkedIn strategy within the professional services industry.
The manufacturing industry consists of businesses involved in utilizing mechanical, physical, or chemical processes to transform materials, substances, or components into new products. This includes assembly workers, machinists, welders, inspectors, production managers, and quality control analysts.
Key LinkedIn insights for the manufacturing industry
Accounts Analyzed
Accounts | Posts | Average posts per period | Average posts per week |
|---|---|---|---|
4,722 | 144,425 | 34 | 2 |
Post Type
Carousel | Image | Other | Video |
|---|---|---|---|
1,394 | 4,477 | 3,431 | 2,672 |
Metrics per Post
Average number of clicks | Average number of comments | Average number of impressions | Average number of likes | Average number of shares | Engagement |
|---|---|---|---|---|---|
72.02 | 0.46 | 899.84 | 17.3 | 1.44 | 1.14% |
Hashtags
Total hashtags used | Posts | Average number of hashtags per post |
|---|---|---|
843,613 | 144,425 | 5.84 |
Emojis
Posts | Emojis | Average number of emojis per post |
|---|---|---|
144,425 | 378,500 | 2.62 |
Description Word Count
Average word count |
|---|
75.6 |
Posting on LinkedIn in the manufacturing industry:
Best day to post on LinkedIn: Thursday
Best time to post on LinkedIn: 10 am
The LinkedIn 2024 Study analyzed 144,425 manufacturing posts across 4,722 accounts, revealing an average of 5.84 hashtags and 2.62 emojis per post, with an average of two posts per week. This data can help you optimize your LinkedIn marketing strategy within the manufacturing sector.
The technology, information, and media industry covers a diverse range of businesses that produce technology products, such as software and data analytics, and provide the means to transmit or distribute these products. This also includes entities involved in film and sound recording production, traditional broadcasting and Internet-only broadcasting, telecommunications, data processing, and web search portals and information services.
Key LinkedIn insights for the technology, information, and media industries
Accounts Analyzed
Accounts | Posts | Average posts per period | Average posts per week |
|---|---|---|---|
2.643 | 207.796 | 79 | 5 |
Post Type
Carousel | Image | Other | Video |
|---|---|---|---|
871 | 2,290 | 2,149 | 1,471 |
Metrics
Average number of clicks | Average number of comments | Average number of impressions | Average number of likes | Average number of shares | Engagement |
|---|---|---|---|---|---|
40.56 | 0.41 | 713.33 | 9.03 | 0.96 | 7.14% |
Hashtags
Total hashtags used | Posts | Average number of hashtags per post |
|---|---|---|
672,985 | 207,796 | 3.24 |
Emojis
Posts | Emojis | Average number of emojis per post |
|---|---|---|
207,796 | 347,095 | 1.67 |
Posting on LinkedIn in the technology, information, and media industries:
Best day to post on LinkedIn: Tuesday
Best time to post on LinkedIn: 10 am
According to a 2024 LinkedIn Study, among 2,643 accounts in the technology, information, and media sectors, a total of 207,796 posts were published. The study found that each account typically posted around 5 times per week. In addition, the average number of hashtags used per account was 3.24, while the average use of emojis was significantly lower than other industries at 1.67.
The education sector comprises a wide array of roles beyond teaching, including educational administrators, policy analysts, ed-tech professionals, career counselors, instructional coordinators, project managers, and educational technologists. These positions collectively contribute to improving educational practices, technology integration, policy development, and career guidance within the sector.
Key LinkedIn insights for the education sector
Accounts Analyzed
Accounts | Posts | Average posts per period | Average posts per week |
|---|---|---|---|
2,063 | 106,644 | 52 | 3 |
Post Type
Carousel | Image | Other | Video |
|---|---|---|---|
733 | 1,900 | 1,696 | 1,234 |
Metrics
Average number of clicks | Average number of comments | Average number of impressions | Average number of likes | Average number of shares | Engagement |
|---|---|---|---|---|---|
74.35 | 0.42 | 870.63 | 12.53 | 1.15 | 10.16% |
Hashtags
Total hashtags used | Posts | Average number of hashtags per post |
|---|---|---|
419,257 | 106,644 | 3.93 |
Emojis
Posts | Emojis | Average number of emojis per post |
|---|---|---|
106,644 | 294,489 | 2.76 |
Posting on LinkedIn in the education industry:
Best day to post on LinkedIn: Wednesday
Best time to post on LinkedIn: 10 am
The 2024 LinkedIn Study analyzed 2,063 education accounts and 106,644 posts. The data reveals that educational accounts on LinkedIn posted, on average three times per week. Single-image posts got the most engagement on the platform, and contained an average of 3.93 hashtags, and 2.76 emojis.
The consumer services sector incorporates a diverse range of roles, from leather, footwear, furniture, electronics, machinery, and auto repair; to personal services like laundry, pet care, and home services. These positions are dedicated to delivering products, assistance, and support directly to consumers, ensuring their needs are met and satisfaction is maintained.
Key LinkedIn insights for the consumer services industry
Key insights for the professional services industry
Accounts | Posts | Average posts per period | Average posts per week |
|---|---|---|---|
1,707 | 83,037 | 49 | 3 |
Post Type
Carousel | Image | Other | Video |
|---|---|---|---|
607 | 1,626 | 1,425 | 1,070 |
Metrics
Average number of clicks | Average number of comments | Average number of impressions | Average number of likes | Average number of shares | Engagement |
|---|---|---|---|---|---|
47,77 | 0.65 | 680.26 | 12.56 | 1.98 | 9.7% |
Hashtags
Total hashtags used | Posts | Average number of hashtags per post |
|---|---|---|
419,257 | 106,644 | 3,93 |
Emojis
Posts | Emojis | Average number of emojis per post |
|---|---|---|
106,644 | 294,489 | 2,76 |
Description Word Count
Average word count |
|---|
78,5 |
Posting on LinkedIn in the consumer services industry:
Best day to post on LinkedIn: Wednesday
Best time to post on LinkedIn: 11 am
The 2024 LinkedIn Study not only found the best days and times for consumer service accounts to post on LinkedIn, but also revealed an average of 3 weekly posts per account. Analyzing the 1,707 accounts and 83,037 posts, the study also found that each post contained an average of 2.76 emojis and 3.93 hashtags.
The administrative and auxiliary services industry includes roles that provide support for the daily operation of other organizations. This includes secretarial roles, staffing and placement, document preparation, security and surveillance services, cleaning, and waste disposal.
Key LinkedIn insights for the administrative and auxiliary services sector
Accounts Analyzed
Accounts | Posts | Average posts per period | Average posts per week |
|---|---|---|---|
1,608 | 70,123 | 44 | 3 |
Post Type
Carousel | Image | Other | Video |
|---|---|---|---|
519 | 1,507 | 1,214 | 853 |
Metrics
Average number of clicks | Average number of comments | Average number of impressions | Average number of likes | Average number of shares | Engagement |
|---|---|---|---|---|---|
46,21 | 0,58 | 799.27 | 9.3 | 1.06 | 7.15% |
Hashtags
Total hashtags used | Posts | Average number of hashtags per post |
|---|---|---|
323,902 | 70,123 | 4,62 |
Emojis
Posts | Emojis | Average number of emojis per post |
|---|---|---|
70,123 | 177,459 | 2,53 |
Posting on LinkedIn in the administrative and auxiliary services sector:
The best day to post on LinkedIn: Monday
The best time to post on LinkedIn: 1pm
The 2024 LinkedIn Study revealed that the average administrative or auxiliary services account on LinkedIn posts approximately 3 times per week and single-image content receives the most shares. In the administrative and auxiliary sector, analysis of 1,608 accounts and 70,123 posts shows an average of 4.62 hashtags and 2.53 emojis per post, emphasizing the importance of relevant hashtags and engaging visuals in enhancing content strategy within this sector.
The construction industry encompasses a variety of jobs and roles, which can be broadly categorized into four major types of construction or engineering projects: residential building, institutional and commercial building, specialized industrial construction, and infrastructure and heavy construction. This also includes roles and jobs like home repair, painting, and plumbing.
Key LinkedIn insights for the construction industry
Accounts Analyzed
Accounts | Posts | Average posts per period | Average posts per week |
|---|---|---|---|
1,592 | 45,216 | 28 | 2 |
Post Type
Carousel | Image | Other | Video |
|---|---|---|---|
451 | 1,502 | 1,057 | 818 |
Metrics per Post
Average number of clicks | Average number of comments | Average number of impressions | Average number of likes | Average number of shares | Engagement |
|---|---|---|---|---|---|
78.75 | 0.41 | 691.44 | 12.65 | 0.98 | 13.42% |
Hashtags
Total hashtags used | Posts | Average number of hashtags per post |
|---|---|---|
237,637 | 45,216 | 5.26 |
Emojis
Posts | Emojis | Average number of emojis per post |
|---|---|---|
45,216 | 123,583 | 2.73 |
Posting on LinkedIn in the construction industry:
The best day to post on LinkedIn: Thursday
The best time to post on LinkedIn: 11am
The 2024 LinkedIn Study analyzed 1,592 construction industry accounts on LinkedIn, comprising 45,216 posts. The study found that these accounts posted approximately twice per week. Furthermore, each post featured an average of 5.26 hashtags, 2.73 emojis, and garnered the highest engagement when they contained a single image, highlighting the importance of visuals and relevant hashtags in construction industry content strategies.
The financial services industry encompasses a wide range of job opportunities, including financial analysts, accountants, budget analysts, insurance sales agents, financial advisors, securities traders, portfolio managers, and quantitative analysts. These roles involve financial management, analysis, and decision-making, with varying levels of responsibility and specialization, catering to diverse career goals and interests.
Key LinkedIn insights for the financial services industry
Accounts Analyzed
Accounts | Posts | Average posts per period | Average posts per week |
|---|---|---|---|
1,585 | 67,536 | 43 | 2 |
Post Type
Carousel | Image | Other | Video |
|---|---|---|---|
589 | 1,498 | 1,212 | 891 |
Metrics per Post
Average number of clicks | Average number of comments | Average number of impressions | Average number of likes | Average number of shares | Engagement |
|---|---|---|---|---|---|
112.59 | 0.57 | 977.04 | 14.88 | 1.37 | 13.25% |
Hashtags
Total hashtags used | Posts | Average number of hashtags per post |
|---|---|---|
273,200 | 67,536 | 4.05 |
Emojis
Posts | Emojis | Average number of emojis per post |
|---|---|---|
67,536 | 160,045 | 2.37 |
Posting on LinkedIn in the financial services industry:
The best day to post on LinkedIn: Thursday
The best time to post on LinkedIn: 10am
Across the 1,585 accounts and 67,536 posts on LinkedIn relating to the financial industry that were analyzed in the 2024 study, the data shows that most posts include an average of 4.05 hashtags and 2.37 emojis per piece of content. In addition, financial industry accounts post on average twice per week.
Hospitality includes brands that provide short-term lodging in establishments such as hotels, motels, AirBnB, and bed and breakfasts. However, the hospitality industry is a broad field that also covers other professions. These businesses often provide additional services to their guests, such as food and beverage management, casino management, sales management, executive chef services, housekeeping management, event planning, and entertainment management.
Key LinkedIn insights for the hospitality industry
Accounts Analyzed
Accounts | Posts | Average posts per period | Average posts per week |
|---|---|---|---|
1,346 | 35,217 | 26 | 2 |
Post Type
Carousel | Image | Other | Video |
|---|---|---|---|
306 | 1,265 | 904 | 738 |
Metrics per Post
Average number of clicks | Average number of comments | Average number of impressions | Average number of likes | Average number of shares | Engagement |
|---|---|---|---|---|---|
62.1 | 0.46 | 669.44 | 13.61 | 1.1 | 11.54% |
Hashtags
Total hashtags used | Posts | Average number of hashtags per post |
|---|---|---|
207,839 | 35,217 | 5.9 |
Emojis
Posts | Emojis | Average number of emojis per post |
|---|---|---|
35,217 | 90,513 | 2.57 |
Posting on LinkedIn in the hospitality industry:
The best day to post on LinkedIn: Thursday
The best time to post on LinkedIn: 10am
In the 2024 LinkedIn Study, 1,346 LinkedIn accounts and 35,217 posts relating to the hospitality industry were analyzed. On average hospitality-related accounts posted twice a week on LinkedIn. In addition, hospitality posts include an average of 5.9 hashtags and 2.57 emoji per post.
The entertainment industry encompasses a wide range of brands that produce, promote, and participate in live shows, events, and exhibitions for public enjoyment, while also preserving and showcasing historical, cultural, and educational artifacts and sites. In addition, brands in the entertainment industry may manage facilities and offer services that cater to clients seeking recreational activities, entertainment, hobbies, and leisure pursuits.
Key LinkedIn insights for the entertainment industry
Accounts Analyzed
Accounts | Posts | Average posts per period | Average posts per week |
|---|---|---|---|
1,335 | 44,489 | 33 | 2 |
Post Type
Carousel | Image | Other | Video |
|---|---|---|---|
283 | 1,201 | 1,001 | 746 |
Metrics per Post
Average number of clicks | Average number of comments | Average number of impressions | Average number of likes | Average number of shares | Engagement |
|---|---|---|---|---|---|
25,17 | 0,28 | 362,37 | 8,85 | 0,85 | 9,7% |
Hashtags
Total hashtags used | Posts | Average number of hashtags per post |
|---|---|---|
226.524 | 44.489 | 5,09 |
Emojis
Posts | Emojis | Average number of emojis per post |
|---|---|---|
44.489 | 123.788 | 2,78 |
Posting on LinkedIn in the entertainment industry:
The best day to post on LinkedIn: Wednesday
The best time to post on LinkedIn: 10am
After analyzing 1,335 entertainment-related accounts on LinkedIn, along with their 44,489 posts and content, the data reveals that the average account posts approximately twice a week. These posts typically contain an average of 5.09 hashtags and 2.78 emojis each.
The rental services sector includes businesses that offer rental, leasing, or the use of physical or non-physical assets. Real estate includes companies that provide associated services like real estate management for clients, facilitating real estate sales, rentals, or purchases on behalf of others, as well as conducting real estate appraisals.
Key LinkedIn insights for real estate and equipment rental industries
Accounts Analyzed
Accounts | Posts | Average posts per period | Average posts per week |
|---|---|---|---|
1,270 | 49,566 | 39 | 2 |
Post Type
Carousel | Image | Other | Video |
|---|---|---|---|
393 | 1,158 | 883 | 718 |
Metrics per Post
Average number of clicks | Average number of comments | Average number of impressions | Average number of likes | Average number of shares | Engagement |
|---|---|---|---|---|---|
24.28 | 0.2 | 233.77 | 5.41 | 0.49 | 13% |
Hashtags
Total hashtags used | Posts | Average number of hashtags per post |
|---|---|---|
268,358 | 49,566 | 5.41 |
Emojis
Posts | Emojis | Average number of emojis per post |
|---|---|---|
49,566 | 147,692 | 2.98 |
Description Word Count
Average word count |
|---|
77.3 |
Posting on LinkedIn in the real estate and rental industry:
The best day to post on LinkedIn: Tuesday
The best time to post on LinkedIn: 12am
In the 2024 LinkedIn Study analysis of 1,270 real estate and equipment rental accounts and their 49,566 posts, it was discovered that the average account posted twice a week. These posts, focusing on real estate and equipment rental, typically contained an average of 5.41 hashtags and 2.98 emojis.
The healthcare industry provides medical care and support services to promote individual health, including both healthcare-focused and combined healthcare-social assistance services. The healthcare industry includes a wide range of jobs, including positions such as medical laboratory technician, EKG technician, and health information technician, as well as advanced careers like registered nurse, nurse practitioner, and physician assistant.
Key LinkedIn insights for the healthcare industry
Accounts Analyzed
Accounts | Posts | Average posts per period | Average posts per week |
|---|---|---|---|
1,146 | 43,480 | 38 | 2 |
Post Type
Carousel | Image | Other | Video |
|---|---|---|---|
302 | 1,069 | 860 | 670 |
Metrics per Post
Average number of clicks | Average number of comments | Average number of impressions | Average number of likes | Average number of shares | Engagement |
|---|---|---|---|---|---|
36.67 | 0.3 | 460.35 | 9.32 | 1.07 | 10.29% |
Hashtags
Total hashtags used | Posts | Average number of hashtags per post |
|---|---|---|
210,715 | 43,480 | 4.85 |
Emojis
Posts | Emojis | Average number of emojis per post |
|---|---|---|
43,480 | 106,435 | 2.45 |
Description Word Count
Average word count |
|---|
79.3 |
Posting on LinkedIn in the healthcare industry:
The best day to post on LinkedIn: Tuesday
The best time to post on LinkedIn: 11am
Of the 1,146 healthcare accounts and 43,480 related posts that were analyzed in the 2024 LinkedIn Study, it’s shown that LinkedIn accounts related to healthcare post an average of two times per week. These LinkedIn posts are shown to have an average of 4.85 hashtags, and use an average of 2.45 emojis per post.
The retail industry involves businesses selling goods or services to the public and encompasses many different types of jobs, from entry-level positions like sales associates and cashiers to management roles such as retail directors and district managers. Other jobs in the retail industry include positions like retail account managers, market development managers, and customer service managers.
Key LinkedIn insights for the retail industry
Accounts Analyzed
Accounts | Posts | Average posts per period | Average posts per week |
|---|---|---|---|
1,040 | 27,896 | 27 | 2 |
Post Type
Carousel | Image | Other | Video |
|---|---|---|---|
252 | 951 | 683 | 543 |
Metrics per Post
Average number of clicks | Average number of comments | Average number of impressions | Average number of likes | Average number of shares | Engagement |
|---|---|---|---|---|---|
59.55 | 0.31 | 509.01 | 9.1 | 0.77 | 13.7% |
Hashtags
Total hashtags used | Posts | Average number of hashtags per post |
|---|---|---|
182,175 | 27,896 | 6.53 |
Emojis
Posts | Emojis | Average number of emojis per post |
|---|---|---|
27,896 | 83,967 | 3.01 |
Posting on LinkedIn in the retail industry:
The best day to post on LinkedIn: Tuesday
The best time to post on LinkedIn: 4pm
The 2024 LinkedIn Study analyzed 1,040 retail industry accounts and 27,896 posts, finding that posts with a single image were the most shared on the platform. The average retail-focused LinkedIn account posted twice a week, with each post using an average of 6.53 hashtags and 3.01 emojis.
The transportation, logistics, supply chain, and storage sectors manages the transportation, storage, and distribution of goods and materials, offering a wide range of job opportunities. This includes transportation drivers, logistics analysts, supply chain managers, and warehouse operations managers, global logistics managers and vice presidents of logistics and supply chain management.
Key LinkedIn insights for the transportation, logistics, supply chain, and storage industry
Accounts Analyzed
Accounts | Posts | Average posts per period | Average posts per week |
|---|---|---|---|
1,022 | 32,112 | 31 | 2 |
Post Type
Carousel | Image | Other | Video |
|---|---|---|---|
296 | 962 | 719 | 544 |
Metrics per Post
Average number of clicks | Average number of comments | Average number of impressions | Average number of likes | Average number of shares | Engagement |
|---|---|---|---|---|---|
63.92 | 0.5 | 771.72 | 15.87 | 1.46 | 10.59% |
Hashtags
Total hashtags used | Posts | Average number of hashtags per post |
|---|---|---|
176,575 | 32,112 | 5.5 |
Emojis
Posts | Emojis | Average number of emojis per post |
|---|---|---|
32,112 | 81,013 | 2.52 |
Description Word Count
Average word count |
|---|
76.1 |
Posting on LinkedIn in the transportation, logistics, supply chain, and storage industry:
The best day to post on LinkedIn: Tuesday
The best time to post on LinkedIn: 1pm
In the 2024 LinkedIn Study, 1,022 transportation, logistics, supply chain, and storage industry accounts with a total of 32,112 posts were analyzed. It’s shown that the average transportation, logistics, supply chain, and storage industry account on LinkedIn posted two times per week. Transportation, logistics, supply chain, and storage industry posts contain an average of 5.5 hashtags and 2.52 emojis.
The Public Administration industry includes a wide range of jobs and career paths focused on improving communities and public services, including administrative officer, public affairs specialist, public relations manager, urban planner, budget analyst, and logistics analyst. This often involves working in government agencies, non-profit organizations, healthcare facilities, universities, schools, private corporations, or non-governmental organizations (NGOs).
Key LinkedIn insights for the public administration sector
Accounts Analyzed
Accounts | Posts | Average posts per period | Average posts per week |
|---|---|---|---|
886 | 47,062 | 53 | 3 |
Post Type
Carousel | Image | Other | Video |
|---|---|---|---|
310 | 843 | 718 | 535 |
Metrics per Post
Average number of clicks | Average number of comments | Average number of impressions | Average number of likes | Average number of shares | Engagement |
|---|---|---|---|---|---|
60.44 | 0.43 | 840.84 | 14.26 | 1.54 | 9.12% |
Hashtags
Total hashtags used | Posts | Average number of hashtags per post |
|---|---|---|
192,890 | 47,062 | 4.1 |
Emojis
Posts | Emojis | Average number of emojis per post |
|---|---|---|
47,062 | 140,885 | 2,99 |
Description Word Count
Average word count |
|---|
77.6 |
Posting on LinkedIn in the public administration industry:
The best day to post on LinkedIn: Thursday
The best time to post on LinkedIn: 9am
The 2024 LinkedIn Study analyzed 886 public administration accounts and 47,062 posts, revealing that the average public administration-related LinkedIn post contained around 4.1 hashtags and 2.99 emojis. Furthermore, public administration accounts on LinkedIn typically posted twice a week, and posts featuring a single image were the most shared on the platform.
The wholesaling industry acts as an intermediary between manufacturers and retailers, acquiring products in bulk and distributing them to retailers. Various roles include internal wholesalers concentrating on sales and marketing, wholesale intake managers managing partner experience and loan submissions, wholesale sales workers selling goods to businesses, wholesale assistants aiding account executives, and wholesale buyers procuring items for resale.
Key LinkedIn insights for the wholesale industry
Accounts Analyzed
Accounts | Posts | Average posts per period | Average posts per week |
|---|---|---|---|
827 | 25,801 | 31 | 2 |
Post Type
Carousel | Image | Other | Video |
|---|---|---|---|
254 | 775 | 577 | 440 |
Metrics per Post
Average number of clicks | Average number of comments | Average number of impressions | Average number of likes | Average number of shares | Engagement |
|---|---|---|---|---|---|
39.12 | 0.27 | 457.11 | 11.47 | 1.19 | 11.39% |
Hashtags
Total hashtags used | Posts | Average number of hashtags per post |
|---|---|---|
147,297 | 25,801 | 5,71 |
Emojis
Posts | Emojis | Average number of emojis per post |
|---|---|---|
25,801 | 81,768 | 3.17 |
Description Word Count
Average word count |
|---|
79.2 |
Posting on LinkedIn in the wholesale industry:
The best day to post on LinkedIn: Friday
The best time to post on LinkedIn: 12pm
In the 2024 LinkedIn Study, researchers analyzed 25,801 posts from 827 accounts related to wholesaling. On average, each account posted twice a week and included 5.71 hashtags and 3.17 emojis in each post.
The agriculture, livestock, and forestry engineering industry covers a range of positions focused on managing and conserving natural resources. Roles in this field include farmers, agricultural workers, shepherds, farm managers, and agricultural technicians. These professionals handle responsibilities like animal care, farming operations, and land management. Moreover, careers in forestry, wildlife management, landscaping, and land-based engineering are also parts of this industry.
Key LinkedIn insights for the agriculture, livestock, and forestry engineering industry
Accounts Analyzed
Accounts | Posts | Average posts per period | Average posts per week |
|---|---|---|---|
448 | 17,345 | 39 | 2 |
Post Type
Carousel | Image | Other | Video |
|---|---|---|---|
179 | 432 | 333 | 292 |
Metrics per Post
Average number of clicks | Average number of comments | Average number of impressions | Average number of likes | Average number of shares | Engagement |
|---|---|---|---|---|---|
79.03 | 0.45 | 1,059.12 | 19.2 | 1.34 | 9.44% |
Hashtags
Total hashtags used | Posts | Average number of hashtags per post |
|---|---|---|
88,152 | 17,345 | 5.08 |
Emojis
Posts | Emojis | Average number of emojis per post |
|---|---|---|
17,345 | 62,972 | 3.63 |
Description Word Count
Average word count |
|---|
79.4 |
Posting on LinkedIn in the agriculture, livestock, and forestry engineering industry:
The best day to post on LinkedIn: Tuesday
The best time to post on LinkedIn: 9am
In the 2024 LinkedIn Study analyzing 448 accounts and 17,345 posts in agriculture, livestock, and forestry engineering, we found that most accounts posted twice a week on average. LinkedIn posts in this industry typically included an average of 5.08 hashtags and 3.63 emojis.
The oil, gas, and mining industry includes roles involved in the exploration, extraction, production, and distribution of natural resources. Jobs under this industry include drillers, project managers, geologists, maintenance workers, petroleum engineers, miners, and various other positions responsible for activities like drilling, mining, refining, and exploration.
Key LinkedIn insights for the oil, gas, and mining industry
Accounts Analyzed
Accounts | Posts | Average posts per period | Average posts per week |
|---|---|---|---|
324 | 12,305 | 38 | 2 |
Post Type
Carousel | Image | Other | Video |
|---|---|---|---|
129 | 317 | 233 | 193 |
Metrics per Post
Average number of clicks | Average number of comments | Average number of impressions | Average number of likes | Average number of shares | Engagement |
|---|---|---|---|---|---|
264.39 | 1.04 | 2,360.62 | 33.74 | 2.64 | 12.79% |
Hashtags
Total hashtags used | Posts | Average number of hashtags per post |
|---|---|---|
48,879 | 12,305 | 3.97 |
Emojis
Posts | Emojis | Average number of emojis per post |
|---|---|---|
12,305 | 28,817 | 2.29 |
Posting on LinkedIn in the oil, gas, and mining industry:
The best day to post on LinkedIn: Tuesday
The best time to post on LinkedIn: 5am
In the 2024 LinkedIn Study, 12,305 posts from 324 accounts related to oil, gas, and mining were analyzed. The study found that the average account in this industry posted twice a week, with each post containing an average of 3.97 hashtags and 2.29 emojis.
The public services and utilities sector covers entities that provide essential services such as electrical power, natural gas, steam supply, water supply, and wastewater disposal. This industry includes the generation, transmission, and distribution of electrical energy; the distribution of natural gas; the supply and/or distribution of steam; the treatment and distribution of water; and the collection, treatment, and disposal of wastewater through sewer systems and treatment facilities.
Key LinkedIn insights for the public services and utilities industry
Accounts Analyzed
Accounts | Posts | Average posts per period | Average posts per week |
|---|---|---|---|
182 | 9,388 | 52 | 2 |
Post Type
Carousel | Image | Other | Video |
|---|---|---|---|
62 | 176 | 149 | 106 |
Metrics per Post
Average number of clicks | Average number of comments | Average number of impressions | Average number of likes | Average number of shares | Engagement |
|---|---|---|---|---|---|
93.49 | 0.48 | 1,375.06 | 18.47 | 2.45 | 8.35% |
Hashtags
Total hashtags used | Posts | Average number of hashtags per post |
|---|---|---|
34,098 | 9,388 | 3.63 |
Emojis
Posts | Emojis | Average number of emojis per post |
|---|---|---|
9,388 | 27,030 | 2.88 |
Posting on LinkedIn in the public services and utilities industry:
The best day to post on LinkedIn: Tuesday
The best time to post on LinkedIn: 10am
In the 2024 LinkedIn Study, 182 accounts and 9,388 posts related to public services and utilities were analyzed. The study found that the average account in this sector posted twice a week, with each post typically containing an average of 3.63 hashtags and 2.88 emojis.
Manage Your Brand’s LinkedIn with Metricool
Armed with the 2024 LinkedIn Study data for your brand’s industry it’s time to start posting.
Metricool empowers you to manage your brand’s LinkedIn account effectively by allowing you to create, schedule, and post content directly on the platform. Furthermore, Metricool offers in-depth analytics for your LinkedIn account and posts, allowing you to monitor your brand’s performance and interact with your audience by replying to LinkedIn messages directly from the Metricool dashboard.
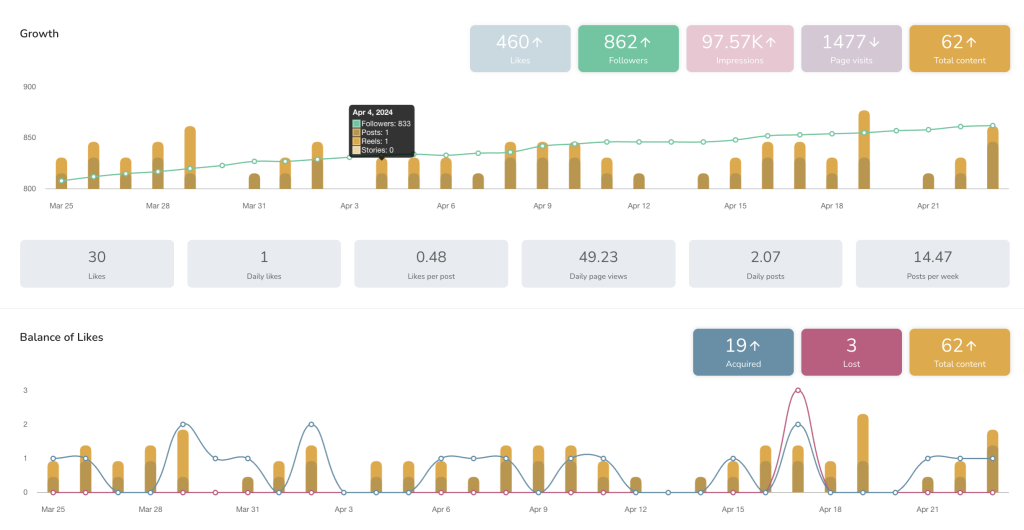
In addition to LinkedIn, Metricool is here to help you to manage all your brand’s social media accounts, including Facebook, Instagram, TikTok, and YouTube. With Metricool, you can create and track ad campaigns, generate custom reports, and discover trending hashtags to boost your brand’s posts across various platforms.
By utilizing Metricool’s features, you can simplify your social media management process, analyze performance metrics, and enhance your brand’s online presence, ultimately contributing to the achievement of your brand’s marketing goals.
Related articles
-
LinkedIn
LinkedIn Tutorial for Beginners: How to Stand Out and Build Your Network
New to LinkedIn? This step-by-step guide shows beginners how to optimize their profile, share content, and connect with the right people.Read more -
Social Media Studies
How Social Media Professionals Use AI in 2025 [Report]
AI isn’t just the future of social media; it’s the engine driving today’s content, strategy, and daily workflows. If you want a real snapshot of how the industry is using artificial intelligence, this is the report you need. We’ve surveyed hundreds of social media managers, freelancers, agency folks, and content creators, and discovered that 96% […]Read more -
LinkedInMetricool
Manage your LinkedIn Account with Metricool
Do you want to manage LinkedIn automatically? I tell you everything you can do on the social network of work with Metricool: the perfect union to succeed on LinkedIn.Read more -
LinkedIn
How to post a job on LinkedIn
Are you going to publish a job offer? LinkedIn is the ideal platform to publish your company's job offers. Find out how to do it in this post.Read more
