Social Media Analytics: Turning Social Media Data Into Strategy
 Emerson Tyler
24 March 2026
Emerson Tyler
24 March 2026 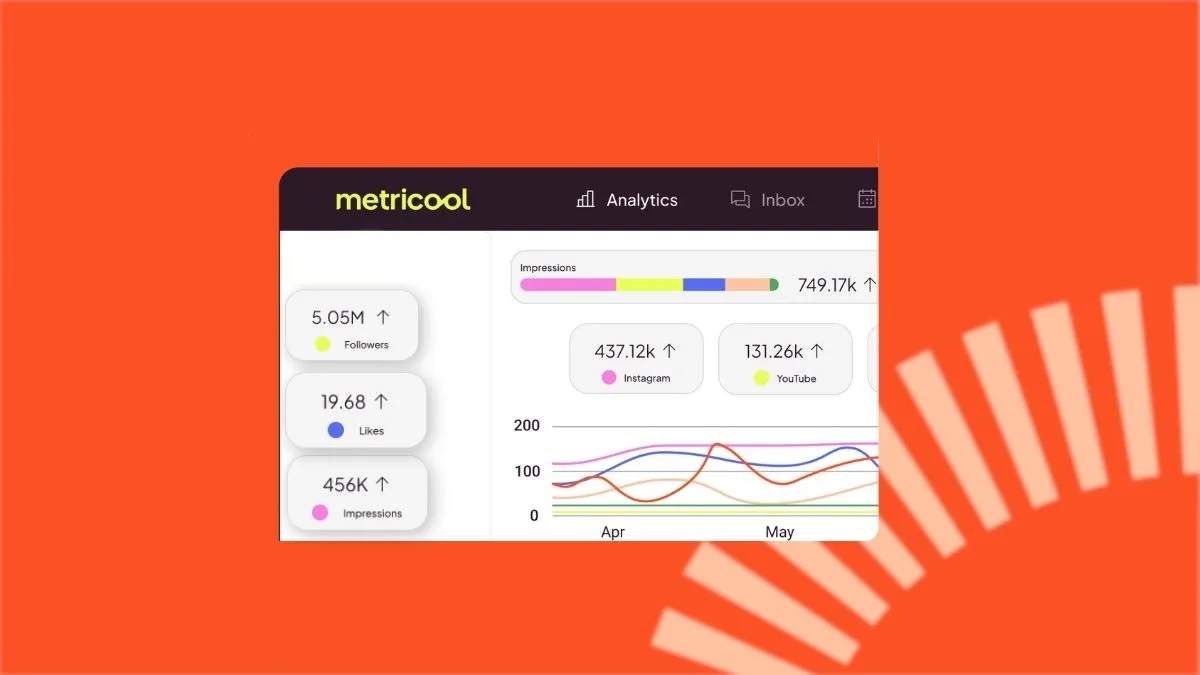
Social media success isn’t just about posting and hoping. It’s about understanding your social media data. Likes, comments, and clicks (aka your metrics) show you what’s happening, but social media analytics is what helps you connect the dots and figure out why. Think of metrics as the puzzle pieces, while analytics is what puts the full picture together. Once you start turning your data into real insight, you can stop guessing and start creating content that actually performs.
What Is Social Media Analytics?
Social media analytics is the process of collecting and analyzing your social media data to understand how your content is performing. Instead of just tracking numbers, it focuses on uncovering patterns, trends, and the reasoning behind those numbers.
It takes raw data and turns it into actionable learnings you can actually use. With the right approach, social media analytics helps you make smarter decisions, refine your strategy, and continuously optimize your content for better results.
Social Media Analytics Vs. Metrics
Social media metrics are your raw social media data. As mentioned above, they give you a snapshot of performance and tell you what’s happening with your content. On the other hand, social media analytics is the interpretation of that data. Analytics takes your raw data and turns it into something meaningful. This is where you move beyond surface-level stats to understand why your content is performing the way it is and how to improve it.
Why Social Media Analytics Matters
Social media analytics helps you go beyond the tip of the iceberg. Instead of just seeing what worked, you start to see patterns, trends, and opportunities. That deeper insight leads to stronger content, smarter decisions, and better overall performance. It also helps you focus on what drives real results. This way, you’re not just posting and waiting to see what happens. Instead, you are building a strategy that improves ROI and takes the guesswork out of your next move.
Key Social Media Data to Track
If you want your social media analytics to actually mean something, you need to focus on the data points that reveal how your content is performing and how your audience is responding over time. Here are a few key data points you should track:
- Engagement Metrics: Likes, comments, and shares that show how people interact with your content
- Reach and Impressions: How many people see your content and how often
- Clicks and Conversions: Actions taken, from link clicks to sign-ups or purchases
- Audience Growth and Demographics: Who is your audience and how is it changing
- Content Performance Trends: Patterns in what types of posts consistently perform best
Social Media Analytics Trends in 2026
Social media analytics in 2026 isn’t just about reviewing last week’s numbers. It’s about responding in real time, predicting what’s coming next, and staying flexible as platforms evolve.
These are the trends shaping how brands track and use data:
1. Generative AI Is Part of the Workflow
AI tools are now standard in social media management. They’re being used to write captions, generate images, and build influencer briefs in minutes instead of hours. AI also helps predict campaign performance before launch, giving teams a head start on what might work.
2. Real-Time Decisions Based on Live Data
Weekly reports aren’t enough anymore. Brands are tracking data in real time, making quick adjustments as they go. Whether something starts trending or engagement drops suddenly, analytics tools help teams respond on the spot.
3. Privacy Is a Top Priority
With new data regulations, analytics tools are focusing more on privacy. That means working with anonymized data and being transparent about how information is collected and used, all while still gathering the insights needed to guide strategy.
4. Personalization at a Whole New Level
Audience targeting is becoming more detailed. With real-time analytics, brands can fine-tune their messaging for smaller segments (even down to individuals) and adjust content based on what people are doing right now.
5. Everything In One Place
More and more platforms are popping up (like Threads or Bluesky), making it harder to keep track of performance across the board. Unified social media analytics dashboards, like Metricool’s, let you monitor all your channels from one place, keeping your strategy consistent.
6. Smarter Visuals and Summaries
Analytics tools are getting better at telling data stories. Expect cleaner charts, AI-generated summaries, and visual dashboards that make it easy to explain performance even to people who aren’t analytics experts.
7. Adapting to Platform Changes
Social platforms are always evolving, from new content formats to AI-powered editing tools. These updates change what gets tracked and how it’s measured, so brands need to stay up to speed.
8. Watching Out for Brand Safety
As platforms become more open to polarizing content, brands need to keep an eye on where their posts are showing up. Analytics tools can flag risky placements or mentions, helping you protect your brand’s image.
9. Tracking Creator and Commerce Data
Social commerce is booming, and creators are driving more results. Analytics now include tracking for live shopping events, affiliate links, and influencer-generated content to help brands understand what actually leads to sales.
Common Mistakes to Avoid
Even with the best social media analytics tools, it’s easy to fall into traps that keep your strategy from reaching its full potential. Paying attention to the wrong data or overcomplicating your insights can lead to wasted effort and missed opportunities. Here are some common mistakes you should avoid:
- Focusing only on surface-level data: Don’t get distracted by likes and shares alone. Look deeper to understand why content performs.
- Ignoring trends and patterns: Consistent monitoring over time reveals what really works and what doesn’t.
- Not aligning analytics with goals: Data is only useful if it informs the objectives you’re trying to achieve.
- Overcomplicating Insights: Keep it simple. Clear, actionable takeaways are more valuable than endless charts and numbers.
Metricool for Social Media Analytics & Reports
Metricool makes it easier to stay on top of your social media analytics, whether you’re managing one brand or juggling several. The platform brings together everything you need to measure performance, understand your audience, and fine-tune your content strategy.
Here’s what you can do with Metricool:
- All-in-One Dashboard: Connect your social media accounts, ad platforms, and even your website analytics for a full view of your online presence.
- In-Depth Metrics: Track impressions, engagement, reach, follower growth, demographics, and more with the context you need to actually make sense of the numbers.
- Competitor Analysis: See how your performance stacks up against competitors in your industry to spot opportunities or gaps.
- Ad Campaign Tracking: Create and monitor your paid campaigns across Facebook, Instagram, and Google, getting clarity on what’s bringing results.
- Custom Reports: Build and automate branded reports that focus on the metrics your team or clients care about most. No extra formatting needed.
- Post Scheduling: Plan ahead, publish across platforms, repurpose content, and tweak your strategy based on what’s working.
- Audience Insights: Learn more about the people engaging with your content, including where they’re from, when they’re most active, and what they’re responding to.
Ready to Turn Your Social Media Analytics Into Results?
Stop guessing and start making data-driven decisions with Metricool. Track your social media analytics, uncover trends, and see exactly what’s working so you can create content that actually performs. Sign up for your Metricool account today and start turning your data points into smarter strategies, stronger engagement, and real results.
