Social Media Reporting Template

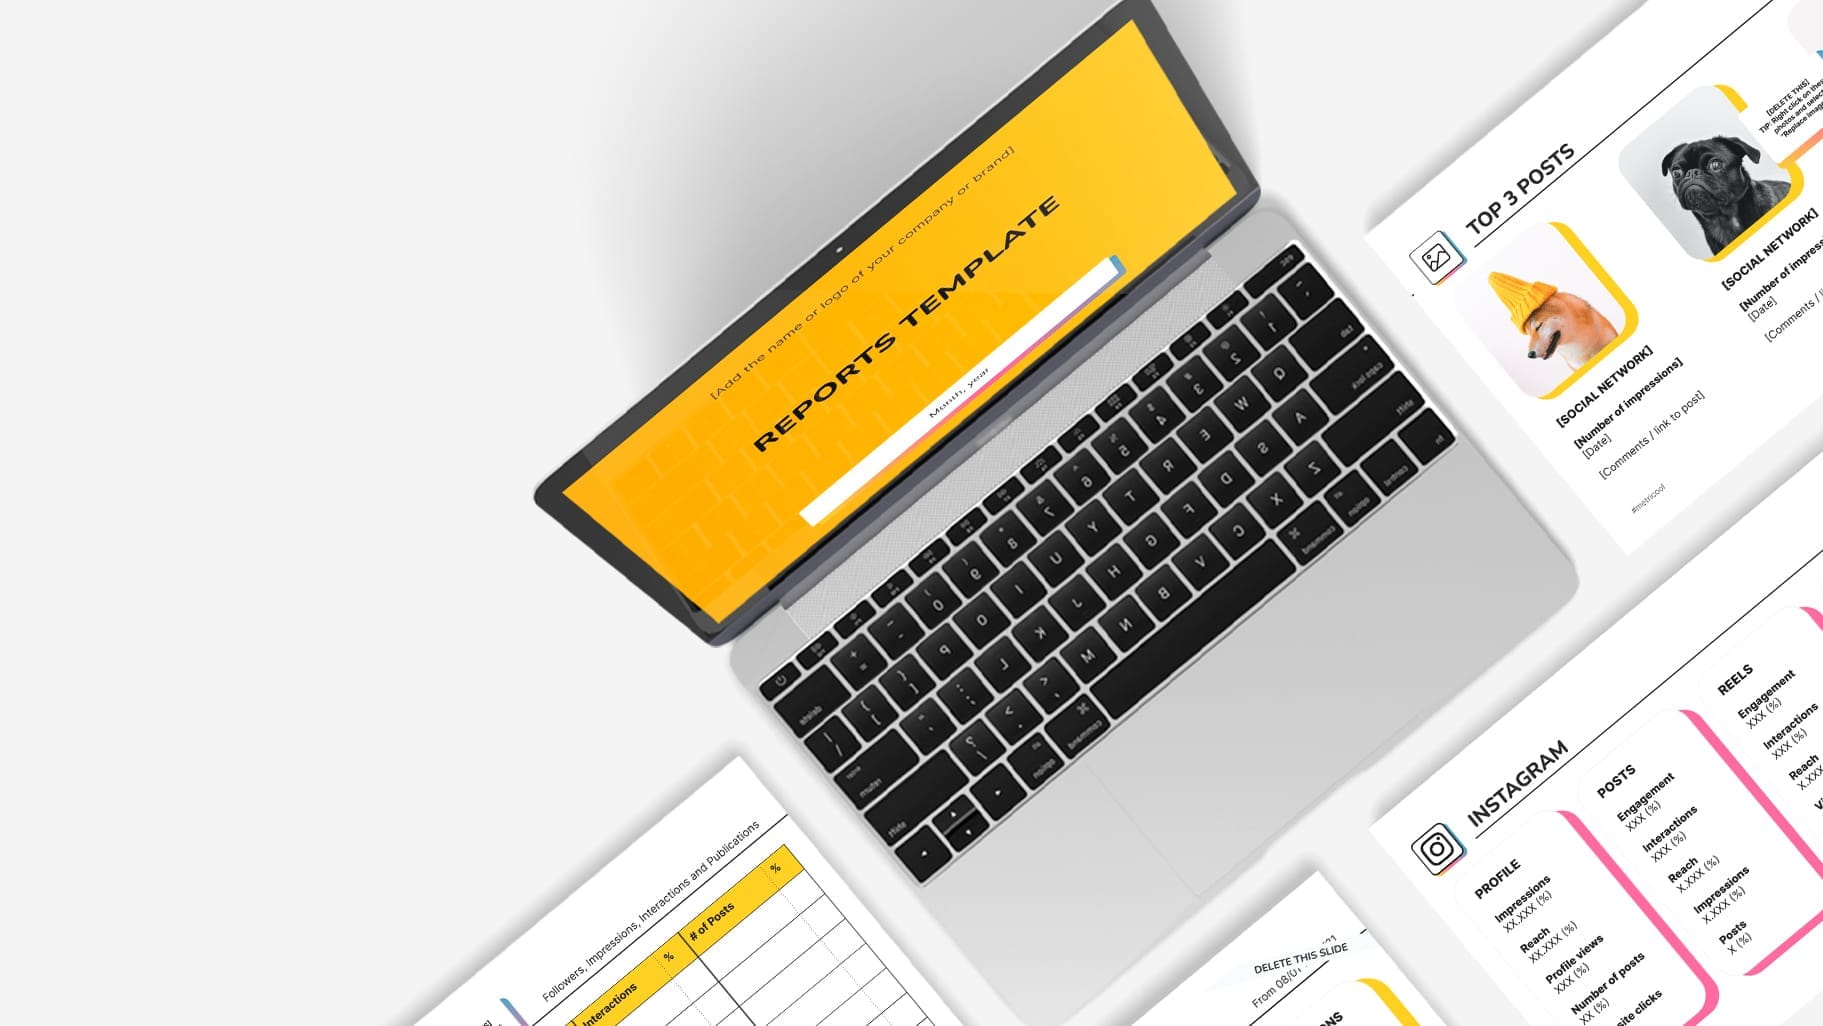
As you already know, with Metricool, you can measure and analyze all your social media accounts. Beyond our platform, we’re giving you a social media report template to make your daily tasks that much easier.
FREE Social Media Reporting Template
First things first! Want to download your social media report template? Fill out this form to get it sent to your inbox.
Now that you have it, let’s go through each slide step by step to make it even easier for you to use.
How to Use the Reporting Template
On the first slide, you will find instructions on how to start using your social media report template.
We recommend you make a copy and work with that, as indicated in the first few lines.
This way, you will always have the original template as a base and only need to update it as necessary.
Summary
On the second slide, you’ll find a section where you can put the company name or logo.
Here begins your report. ⚠️
In this initial section, you have space to summarize the month and highlight key aspects of each channel, such as the top performing posts by interactions or publications.
Want to find this data? You have two ways:
- Manually from each social media platform = hours and hours of data collection.
- From Metricool: with just one click, you can access metrics for all the social media platforms you work with.
Analysis by Social Network
Now it’s time to break down your metrics and get analytical.
In this section, you’ll find a slide dedicated to each platform in your report: website or blog, Instagram, Facebook, etc.
There’s space for each platform/social network to include metrics specific to that one. Of course, each platform will have its own corresponding data—no Reels on X, for example.
This gives you precise control over all the metrics across your accounts.
Key Learnings and Challenges
This final section is for your notes and comments.
The first part focuses on highlights. Here, you have three spaces to add key data points that caught your attention.
In the second section, you’ll find learnings. It’s a space to jot down insights gained during the month or period you’ve chosen to analyze.
For example, infographics have performed well on Instagram.
And what comes after highlights and learnings? The challenges you aim to tackle in the coming month. Armed with all your measured data, you have the information to set realistic and achievable goals.
For example, if infographics have been successful on your Instagram account, a challenge could be to share more of them or to explore other content types to boost engagement further.
Advantages of Using a Report Template
Why use this social media report template?
At first glance, it might not catch your eye. After reading this post, however, you might think, “Oh, interesting. What else does this bring to my daily routine?”
- Centralized and Organized Information: You have all your key information highlighted and well-organized.
- Customizable Sections: The template’s sections serve as your personal library. You can edit it to your liking, delete slides that aren’t relevant, and more.
- Strategic Planning: With a wealth of information at your fingertips, you can better plan your strategy for the coming months, setting realistic goals and objectives.
- Team Collaboration: Drive makes it easy to collaborate online using this template. Each member of your team can add data or focus on specific parts of the template in real-time.
Now that you know how to work with our social media report template, you can better keep all your analytics clean and organized.
Want to download your social media reports with just one click? With Metricool, you can do this all in less than 5 minutes.

