2023 Social Media Networks Study: Trends for 2024
 Isabel Romero
12 December 2023
Isabel Romero
12 December 2023 
#AYearInMetrics
What Has Happened in 2023 and 2024 Social Media Trends
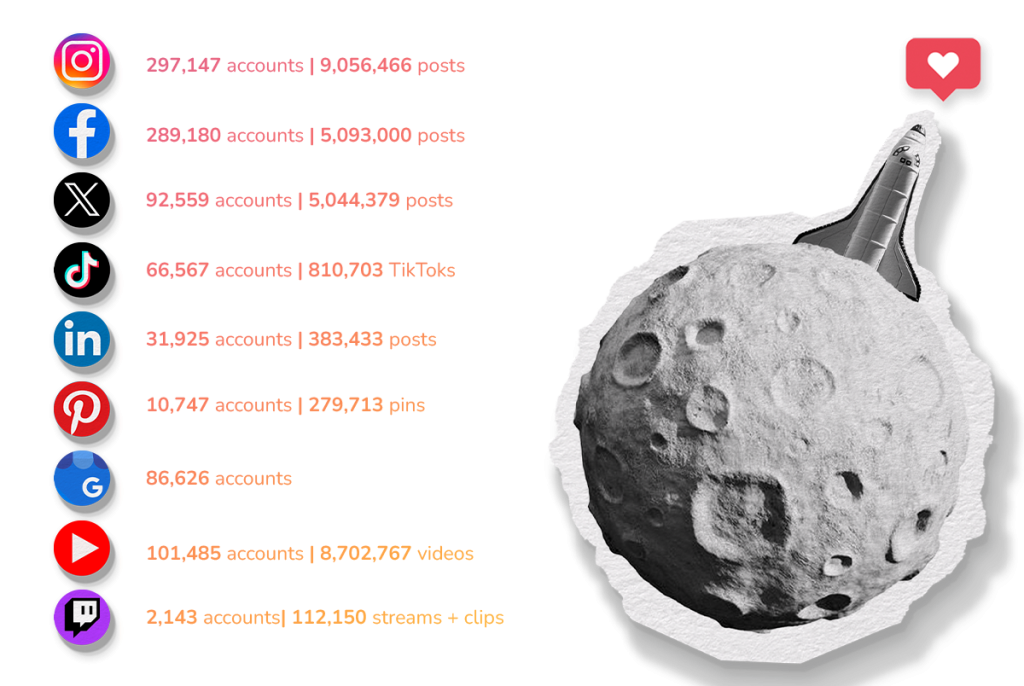
This study is based on the analysis of 9 social media networks, 978,379 accounts, and 29,482,611 posts.
In the annual social media study, we analyzed the professional use of each social media platform, which can help us extract powerful conclusions such as:
→ The evolution of each social media network, independently.
→ Which network and strategies work best, based on your brand’s goals.
We also compared this year’s data with that of the previous year to measure the evolution.
To guarantee that the data is reliable without variation, our study parallels that of 2022, in comparison with 2023.
Account grouping
The analyzed accounts are separated into groups, depending on their following. The idea is to be able to analyze the results with comparable accounts and see how the data evolves as the account following increases.
Therefore, we created five different groups according to the number of followers:
| Tiny | 0 – 500 followers |
| Small | 500 – 2K followers |
| Medium | 2K – 10K followers |
| Big | 10K- 50K followers |
| Huge | 50K – 55M followers |
Naming: small accounts – large accounts
In the study, we talk about “small accounts” and “large accounts”. When we refer to small accounts, we mean any group smaller than the previous one, and vice versa.
In other words, a small account doesn’t necessarily have to be those accounts with 0-500 followers, because it could also refer to those with 10K-50K, compared to those with 50K-55M followers.
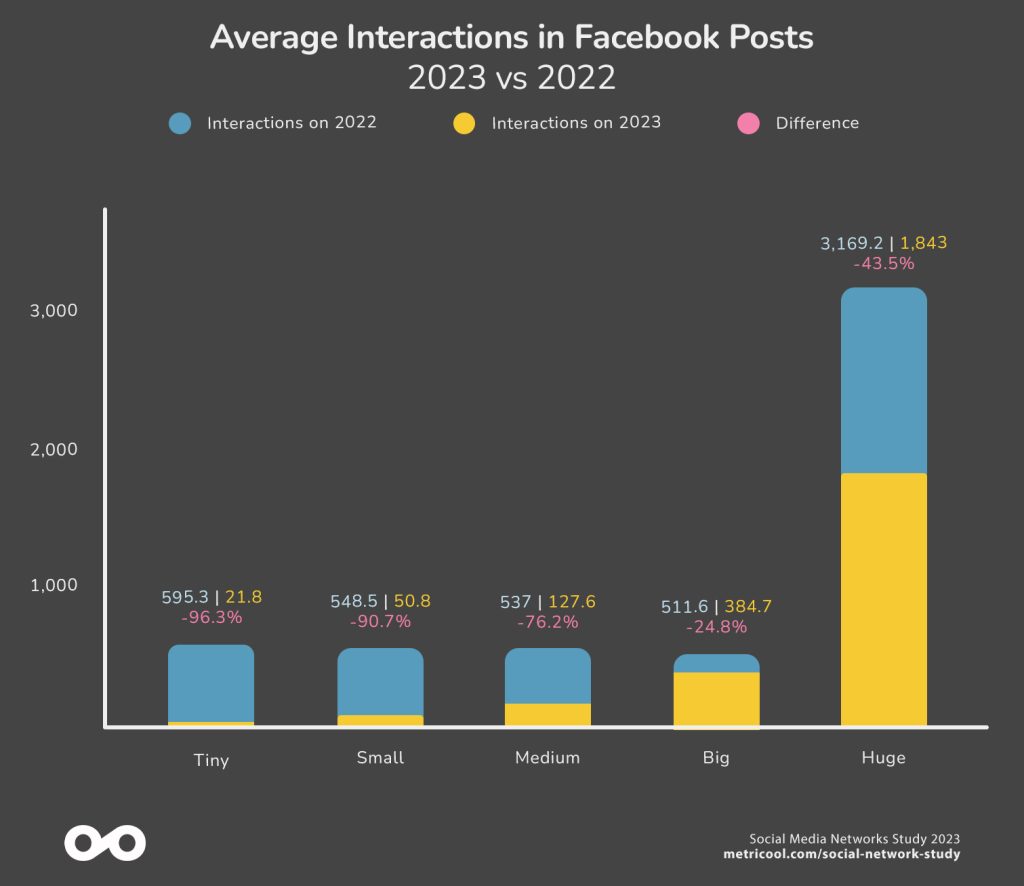
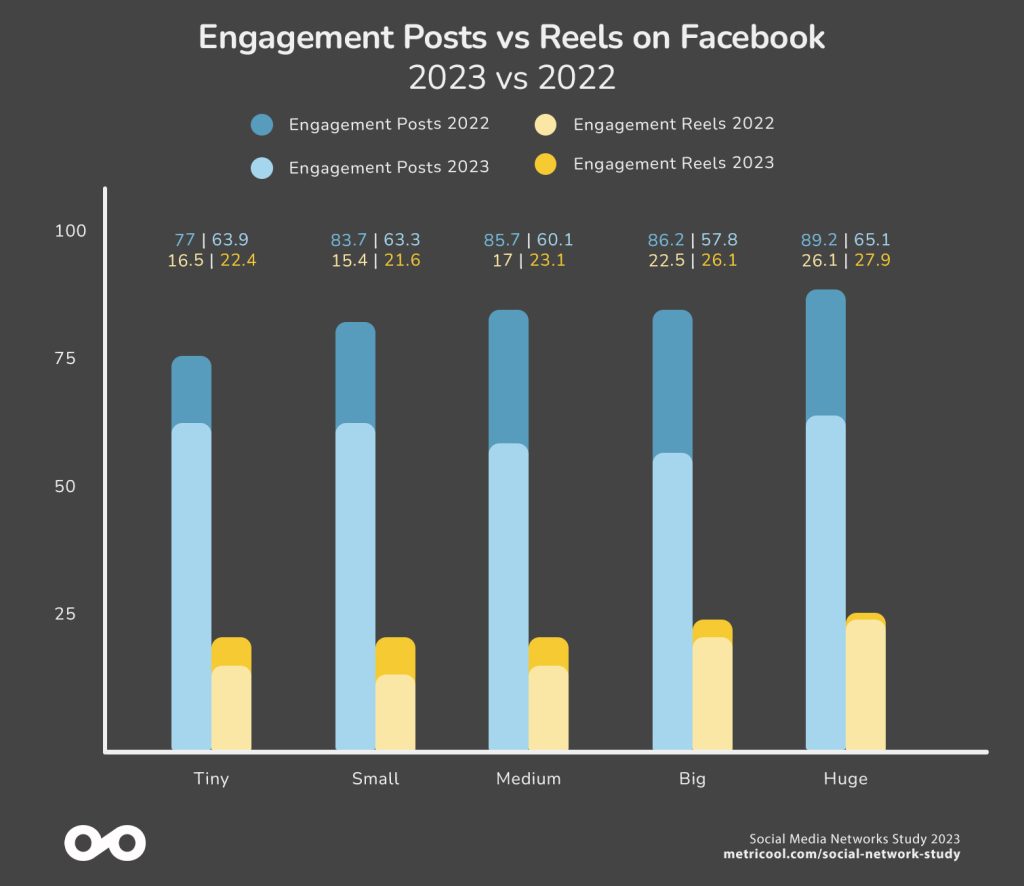
The results of this study show that Facebook is experimenting with some important changes. For one, the rise in Reels, which can be proved with the decrease in post reach and interactions.
| 2022 | 2023 | |
| Accounts | 211,060 | 289,180 |
| Posts | 4,207,102 | 5,093,000 |
| Reels | 91,328 | 699,037 |
After analyzing more than 280,000 Facebook accounts and more than five and a half million posts and reels, the data speaks for itself.
Decline in Facebook usage for brands
All user-interaction data has decreased in 2023. This shows that there is a significant shift for this social network.
Reels sweep in the number of posts
Without a doubt, this is the year of Reels. Brands have posted 600% more Reels compared to 2022. However, these efforts have not resulted in increased interaction and reach data. The only positive data is Reel engagement, which increased by 33%.
*This increase may be due to Meta’s efforts to repurpose Instagram content on Facebook.
| Engagement rate Reels | 2022 | 2023 | Difference |
| Tiny | 16.5 | 22.4 | 35.68% |
| Small | 15.4 | 21.6 | 40.51% |
| Medium | 17 | 23.1 | 35.35% |
| Big | 22.5 | 26.1 | 15.97% |
| Huge | 26.1 | 27.9 | 7.05% |
Post vs Reels
This engagement tells us that Reels are the content that more users are drawn to, while the engagement rate for posts has decreased considerably.
The posting frequency of feed posts has also decreased in all account sizes.
| Weekly posting frequency of Facebook posts | 2022 | 2023 | Difference |
| Tiny | 3.2 | 1.85 | -42.85% |
| Small | 3.3 | 2.64 | -20.57% |
| Medium | 12.2 | 3.72 | -69.49% |
| Big | 8.20 | 6.08 | -25.37% |
| Huge | 51.8 | 14.58 | -71.88% |
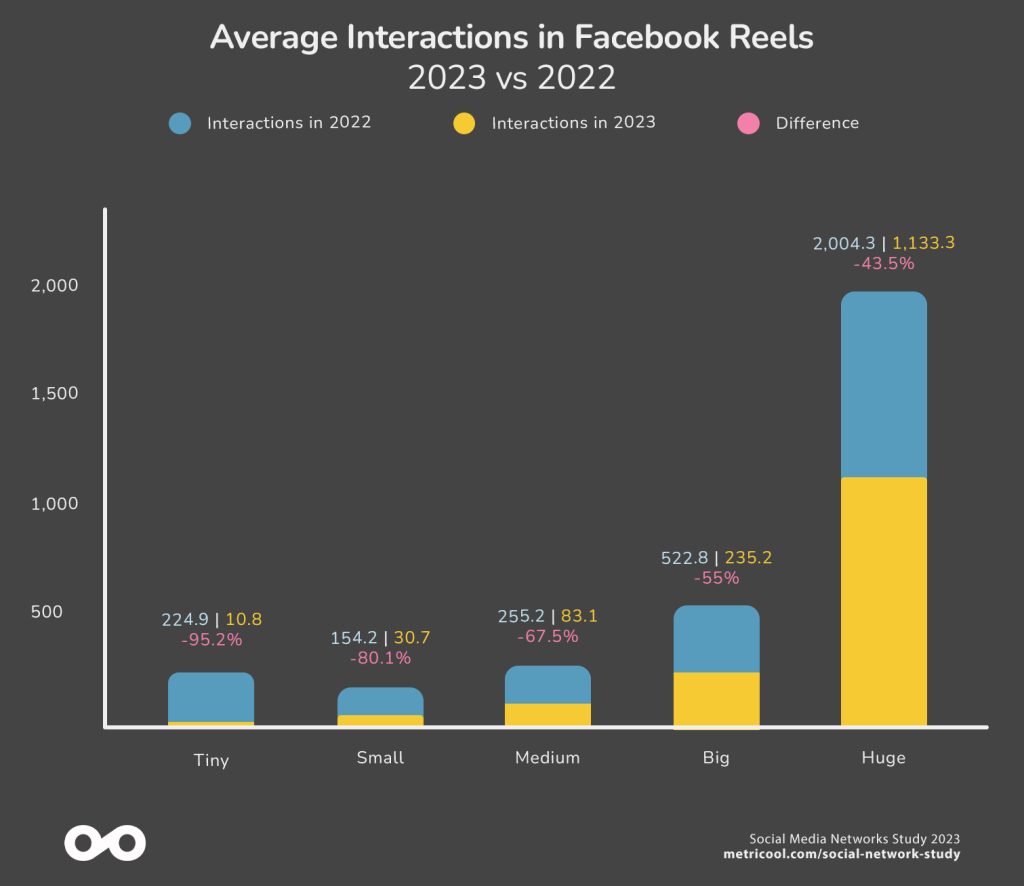
Meanwhile in Reels, the format with increased engagement, the weekly posting frequency has skyrocketed.
| Weekly posting frequency of Facebook Reels | 2022 | 2023 | Difference |
| Tiny | 0.10 | 0.49 | 372.56% |
| Small | 0.07 | 0.43 | 483.01% |
| Medium | 0.39 | 0.99 | 151.35% |
| Big | 0.18 | 0.98 | 447.78% |
| Huge | 1.67 | 3.87 | 131.69% |
Trends for Facebook in 2024
Based on the analyzed data, the trend for growth on Facebook in 2024 is reliant on Reels.
Brands are spending less and less effort on Facebook, and these efforts are centered on repurposing content from other social media platforms. It seems that in the new year, this will continue to be the trend.
Adapting to these network changes will be key.
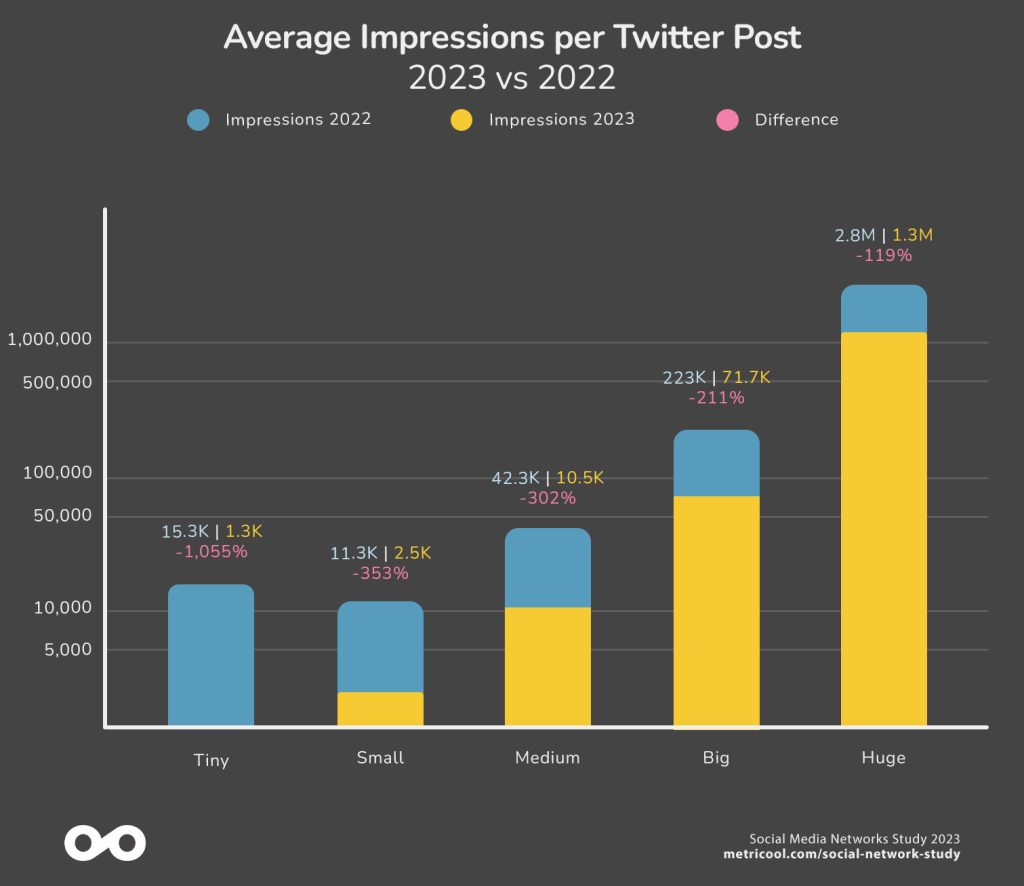
Twitter experienced a significant drop in impressions across all account sizes, indicating a decrease in content reach overall.
Interactions metrics have positive growth minus the Tiny accounts, except in clicks and mentions, suggesting that users are interacting more with the content they see.
| 2022 | 2023 | |
| Accounts | 60,298 | 92,559 |
| Posts | 4,405,595 | 5,044,379 |
Increased posting frequency, as account size grows
Although the posting frequency has decreased in comparison to the last year, the average number of posts has increased according to the size of the account.
There is a jump in “Huge” accounts that published an average of 80.7 times per week. Therefore, the largest accounts are more active on the platform and generate more content.
| Weekly posting frequency | 2022 | 2023 | Difference |
| Tiny | 7.7 | 5 | -35.55% |
| Small | 10.6 | 8.2 | -22.73% |
| Medium | 17.4 | 13.1 | -25.07% |
| Big | 29.7 | 20.4 | -31.50% |
| Huge | 119.9 | 80.7 | -32.67% |
And higher engagement for all accounts
It seems that besides the decrease in impressions, the rise in interactions has contributed to the increase in engagement. Meaning, the content may reach less people, but those who see it tend to interact more.
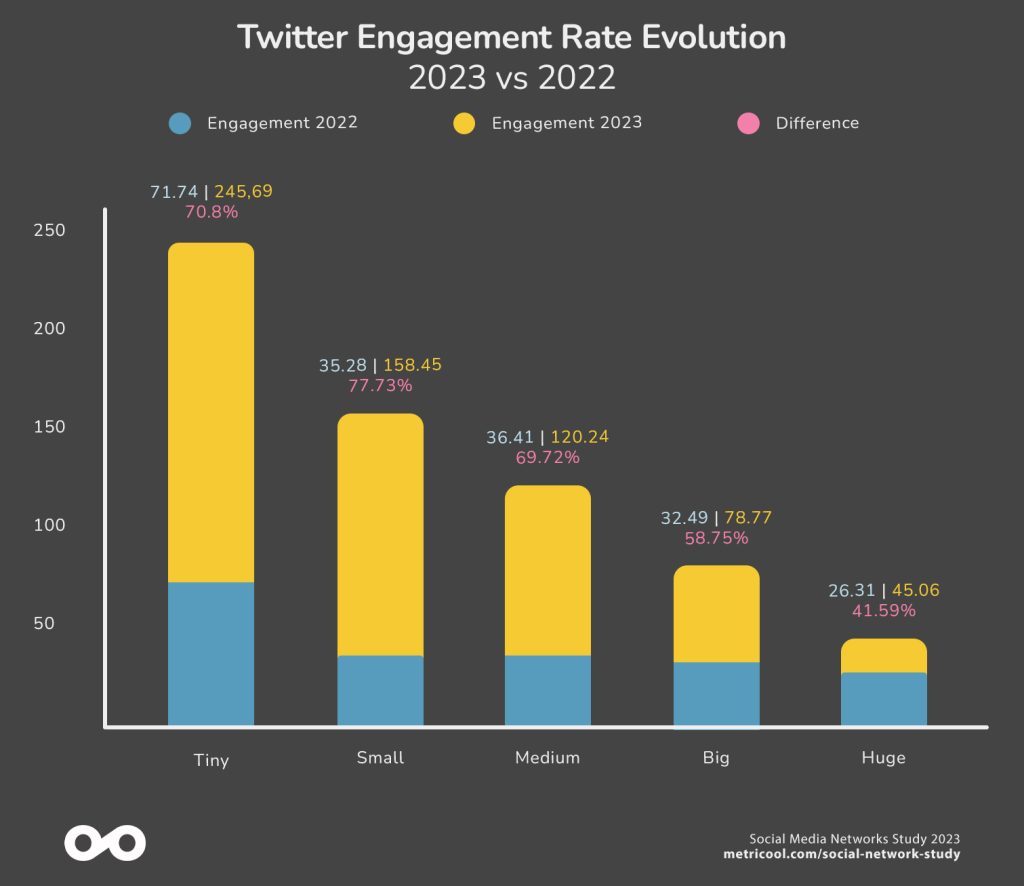
Decrease in impressions across all account types
Trends for 2024: There is life on Twitter after its change to X
In summary, the study suggests that Twitter continues to be an effective platform in terms of interactions, even despite the drop in impressions, the algorithm changes, and account size.
Therefore on X (Twitter), if your goal for 2024 is to generate more brand awareness by sparking conversations with your clients and customers, X can help you.
On LinkedIn in 2023, we noticed a decrease in impressions and a smaller decrease in interactions. As a result, engagement tends to be higher. Even though brand content isn’t reaching as many people, it reaches those who are interested in the content.
We analyzed overall comparative LinkedIn data: impressions, interactions, reactions, comments, shares, clicks, engagement, weekly posting frequency, and the number of LinkedIn accounts by size.
| 2022 | 2023 | |
| Accounts | 12,960 | 31,925 |
| Posts | 173,157 | 383,433 |
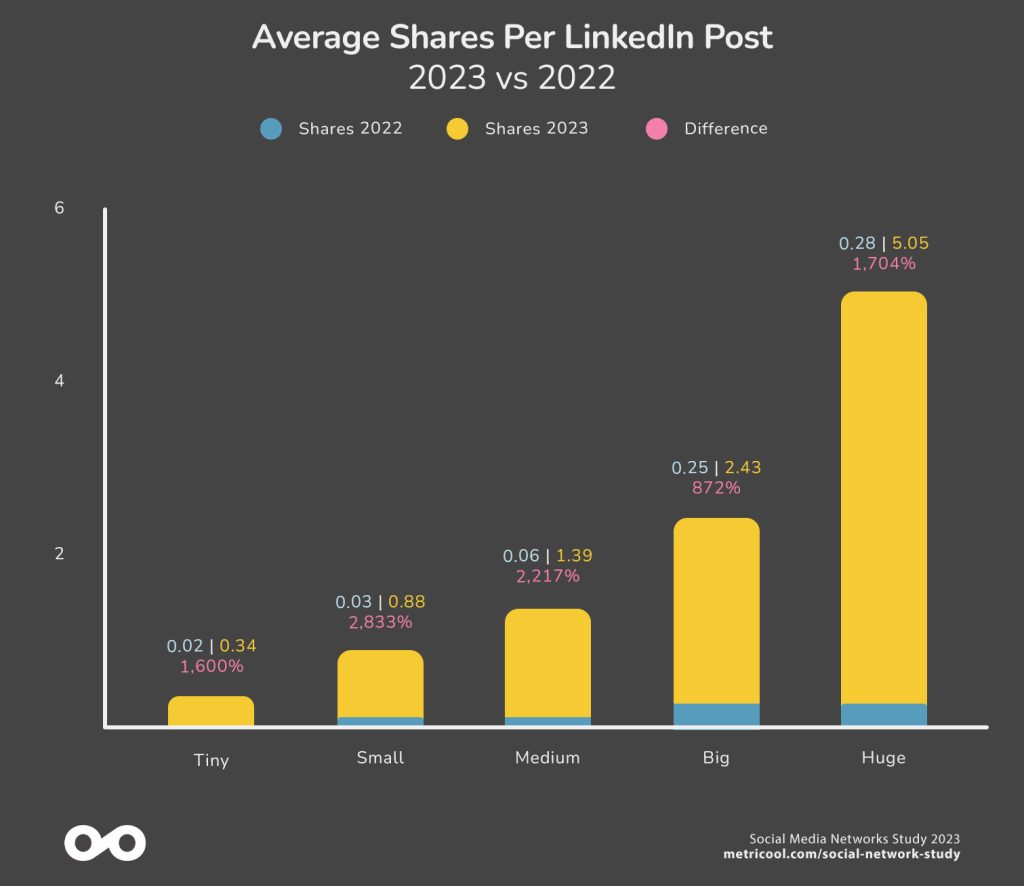
Relevant and shareable content
Virality is booming, hence the importance of creating content that resonates with your audience and encourages them to share.
This can be seen in the number of shares, which has increased significantly.
Posting frequency per account size
The smallest accounts (Tiny and Small) stand out even though they are the ones that post the least, while the rest of the accounts’ posting frequency has increased.
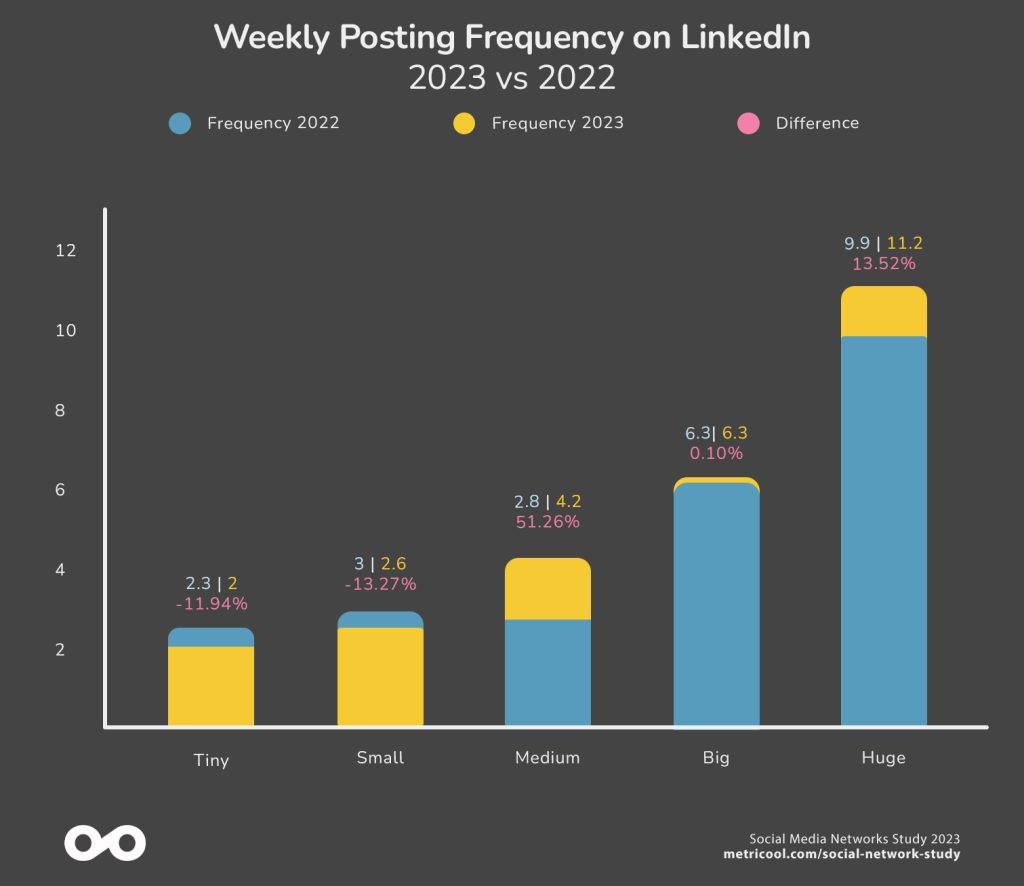
Apart from this data, engagement continues to be higher in smaller accounts, with a drop on Huge accounts.
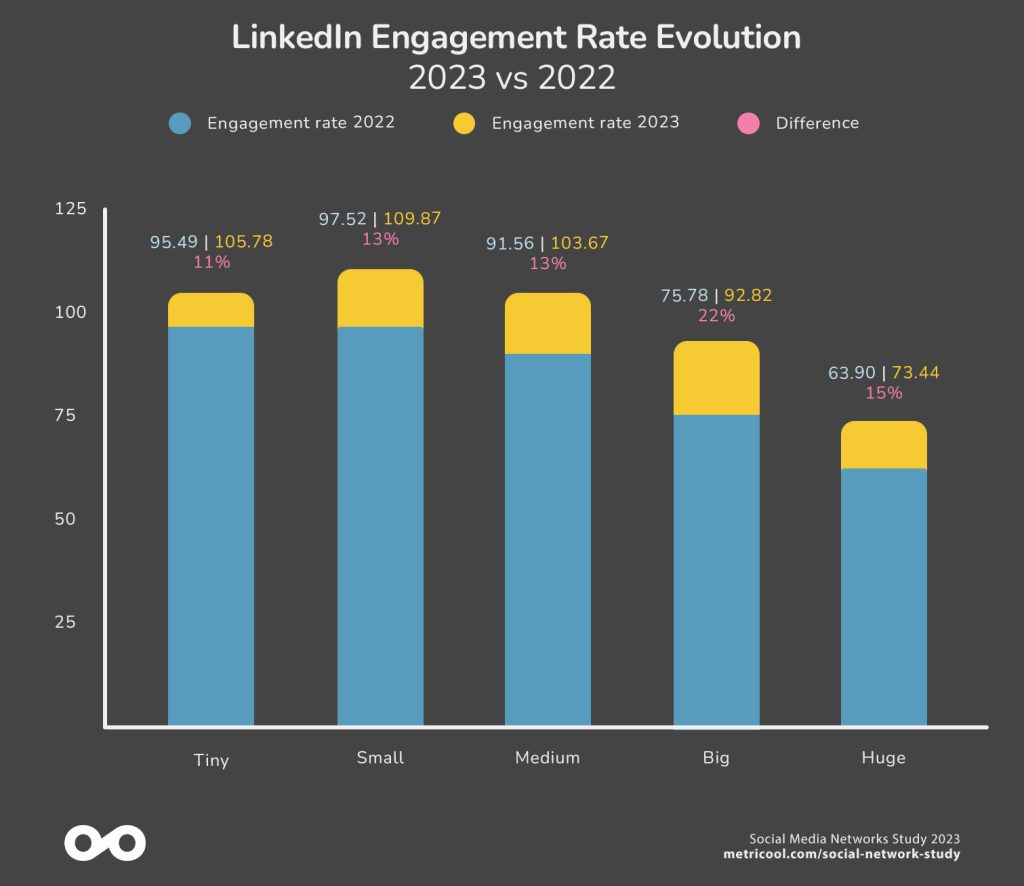
Increased participation. Increase in interactions and engagement:
The increase of more than 141% in interactions and more than 12% in the engagement index indicates increased audience participation.
This increase is attributed to higher interaction per post and that LinkedIn and its algorithm may be promoting activity.
Trends for LinkedIn in 2024
From 2022 to 2023, we saw that LinkedIn was more efficient: fewer posts, but more powerful and increased engagement. Although sharing is the star interaction, it’s a sign that people want to see content that matters to them.
For 2024, it seems that less is more, but it has to be content that is shareable. Diversity in account size seems to be maintained, so everyone has a place on LinkedIn, which is increasingly more about content and interaction than recruiting.
Let’s go with a quick overview of the key changes on Pinterest during 2023 and the trends for next year. These were the data analyzed.
In the case of Pinterest, it is global data without separation by account size, since the platform through its API does not provide this information.
| 2022 | 2023 | |
| Accounts | 3,641 | 10,747 |
| Pins | 77,900 | 279,713 |
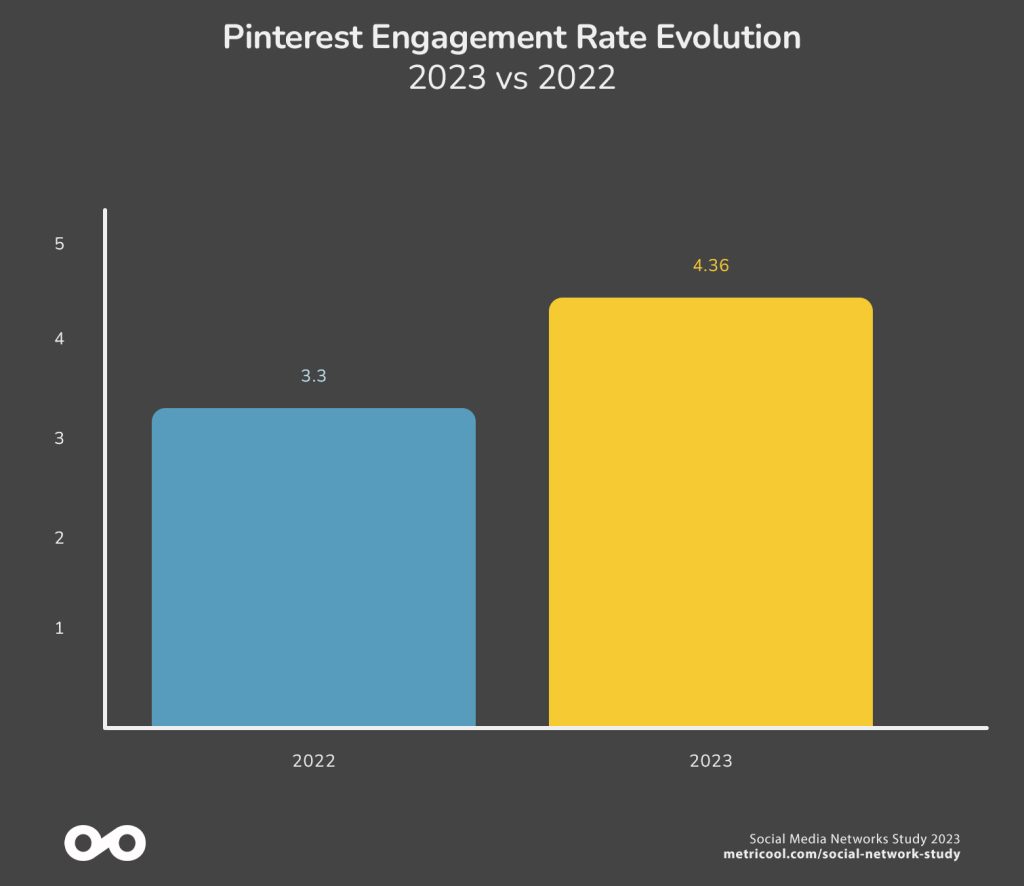
Pinterest remains the platform for discovery
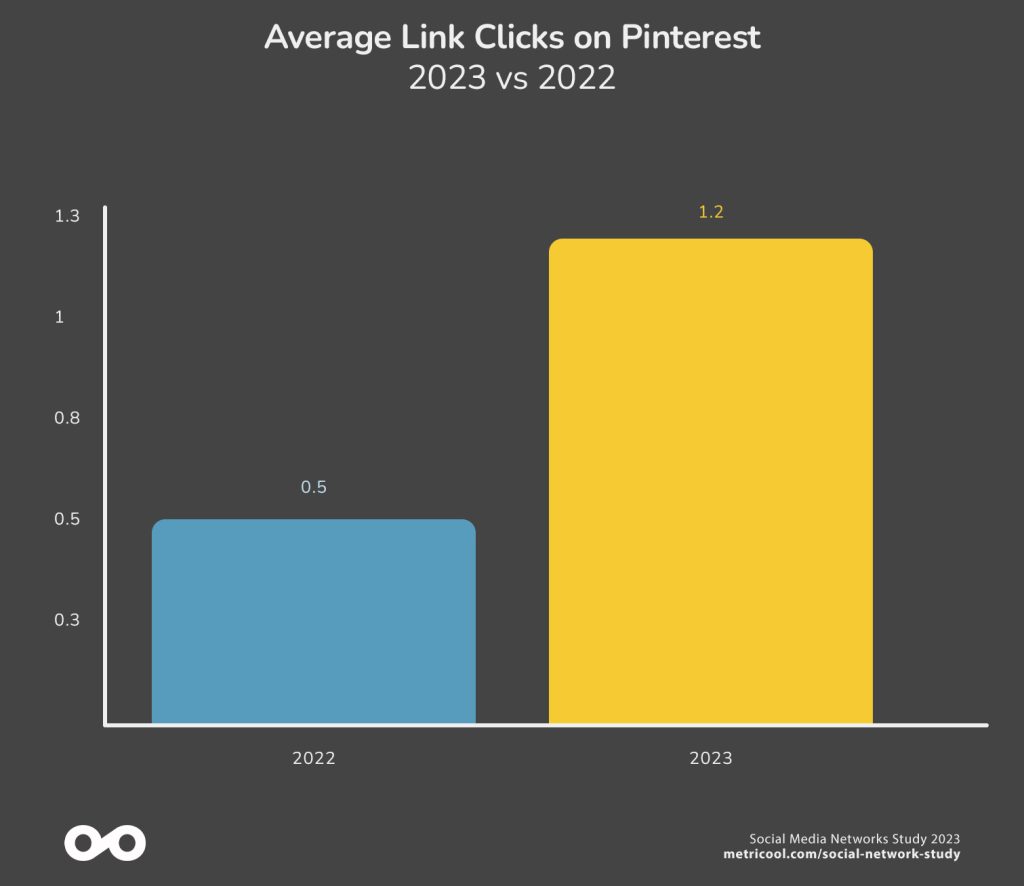
Engagement is up on Pinterest at 32%, and the star interaction that has driven this rise is clicks to external links.
So it reaffirms the idea that Pinterest is not only the social media network for discovery, but it also generates traffic to your website.
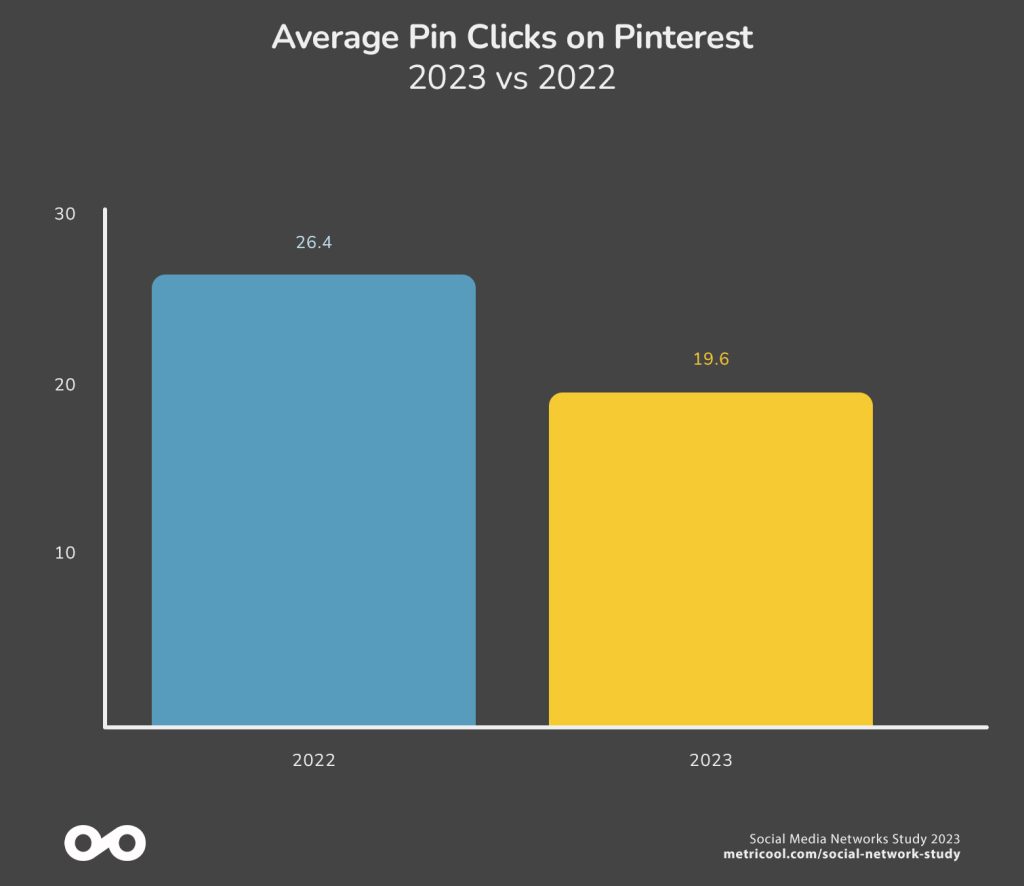
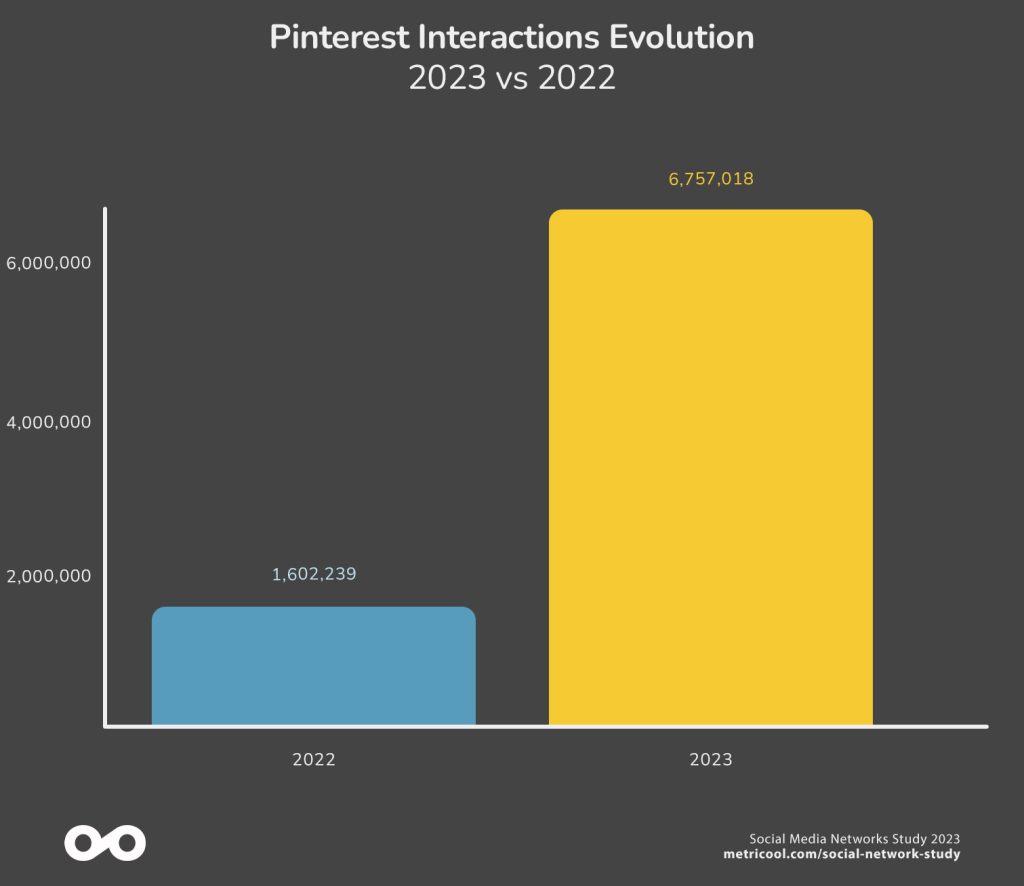
Where user participation continues to grow
Users are not only viewing content, but interaction with the content has grown by more than 17.4%, from clicking on links to saving content. This emphasizes the importance of user-centric strategies and actionable content.
Pinterest trends for 2024
Considering the data from the study, we anticipate some key trends and changes for 2024.
With the large increase in clicks on pins to go to external urls and the platform’s shopping features, Pinterest will cement itself as a social network for direct purchase. Brands must be prepared to create eye-catching pins that invite interaction to finalize transactions.
Visual quality will be a key point to stand out and get as many interactions and clicks as possible.
Twitch
Twitch has experienced changes in 2023: growth in the average length of streams, an explosion in video viewing on larger accounts, and a drop in the frequency of streams.
| 2022 | 2023 | |
| Accounts | 1,107 | 2,143 |
| Clips | 67,257 | 89,663 |
| Streams | 11,662 | 22,487 |
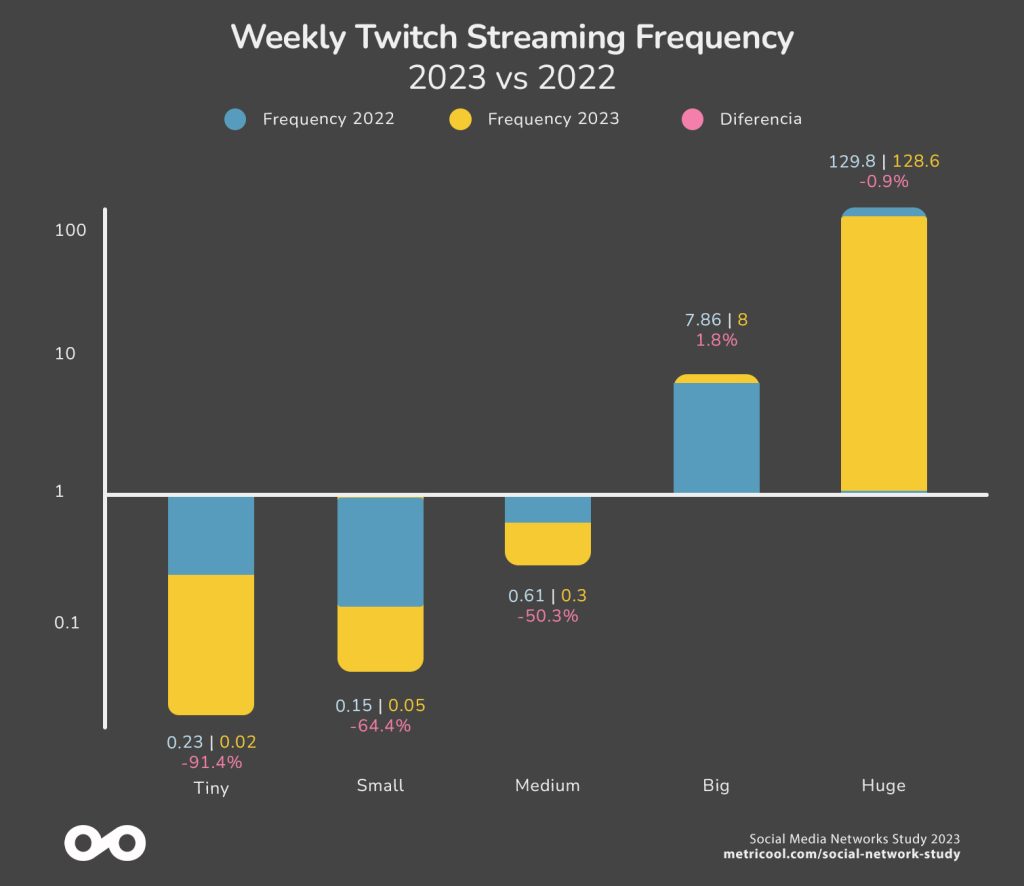
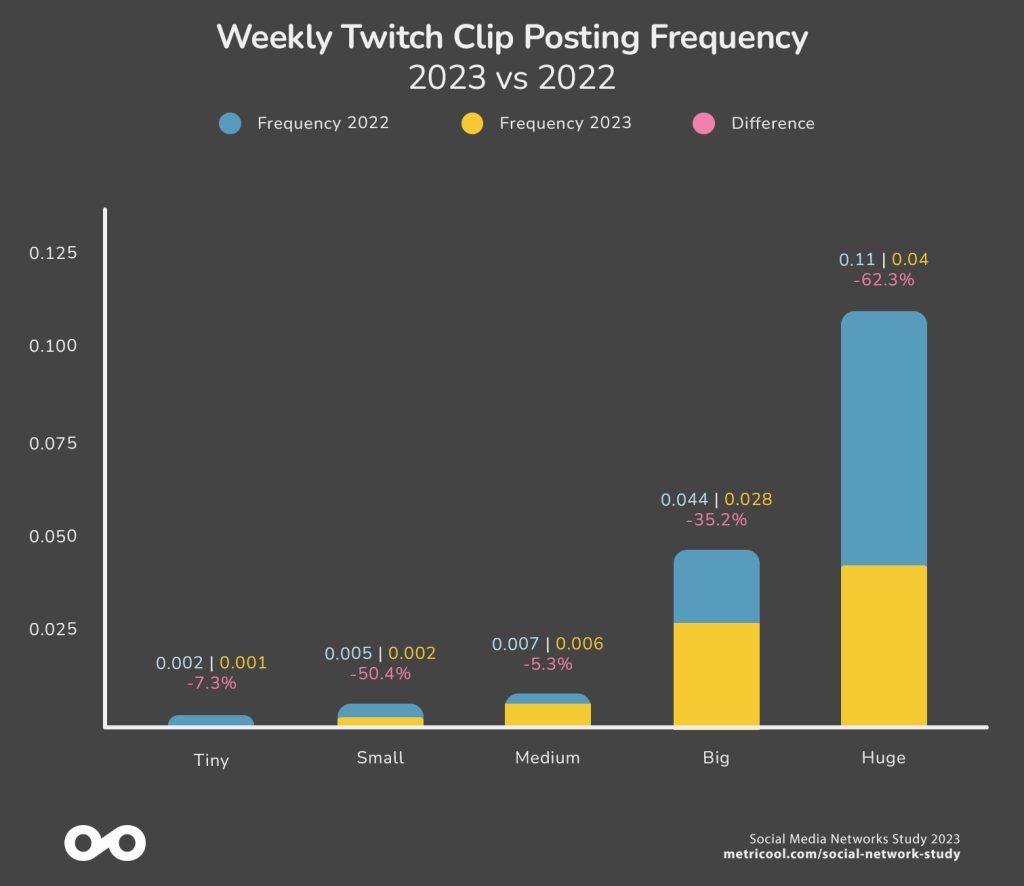
Changes in publication frequency
The “Tiny” and “Small” categories show significant decreases in weekly stream posting frequency, except for the “Big” category which has a slight increase. In terms of clips, the steepest decrease is for the “Small” and “Huge” accounts.
This suggests that there are changes in content strategy, with creators focusing on quality over quantity.
Video duration increases
The average length of streams on Twitch has seen an overall growth from 2022 to 2023.
Suggesting that content creators are devoting more time to their streams.
| Average stream duration in minutes | 2022 | 2023 | Difference |
| Tiny | 7,286.8 | 8,142 | 11.74% |
| Small | 10,756.4 | 11,159.2 | 3.74% |
| Medium | 10,244.8 | 11,880.8 | 15.97% |
| Big | 11,050.2 | 11,285.6 | 2.13% |
| Huge | 14,566.3 | 15,486.2 | 6.32% |
Large accounts claim victory in views
The larger the account, the longer the duration, the frequency of publication and the number of views.
It is the Medium, Big and Huge accounts that have increased their number of views despite having a lower frequency than in 2023.
| Average views | 2022 | 2023 | Difference |
| Tiny | 646 | 96.6 | -85.05% |
| Small | 142.1 | 113.4 | -20.19% |
| Medium | 395.4 | 413.6 | 4.59% |
| Big | 1,617.8 | 4,081.5 | 152.28% |
| Huge | 18,914 | 40,242.2 | 112.76% |
What trends are expected for 2024 on Twitch?
Quality vs. quantity
Twitch is maturing as a streaming platform and if one premise seems clear based on the data analyzed, it is that streamers must offer quality content focused on their audience rather than quantity.
In 2023, the adoption of Reels on the platform is a fact; the increase in the frequency of publication corroborates this. However, a decrease in the average reach, reposts and participation is observed, which marks a change in the dynamics of the platform.
| 2022 | 2023 | |
| Accounts | 167,952 | 297,147 |
| Posts | 1,637,607 | 2,486,041 |
| Reels | 656,044 | 1,373,460 |
| Stories | 5,137,036 | 5,196,965 |
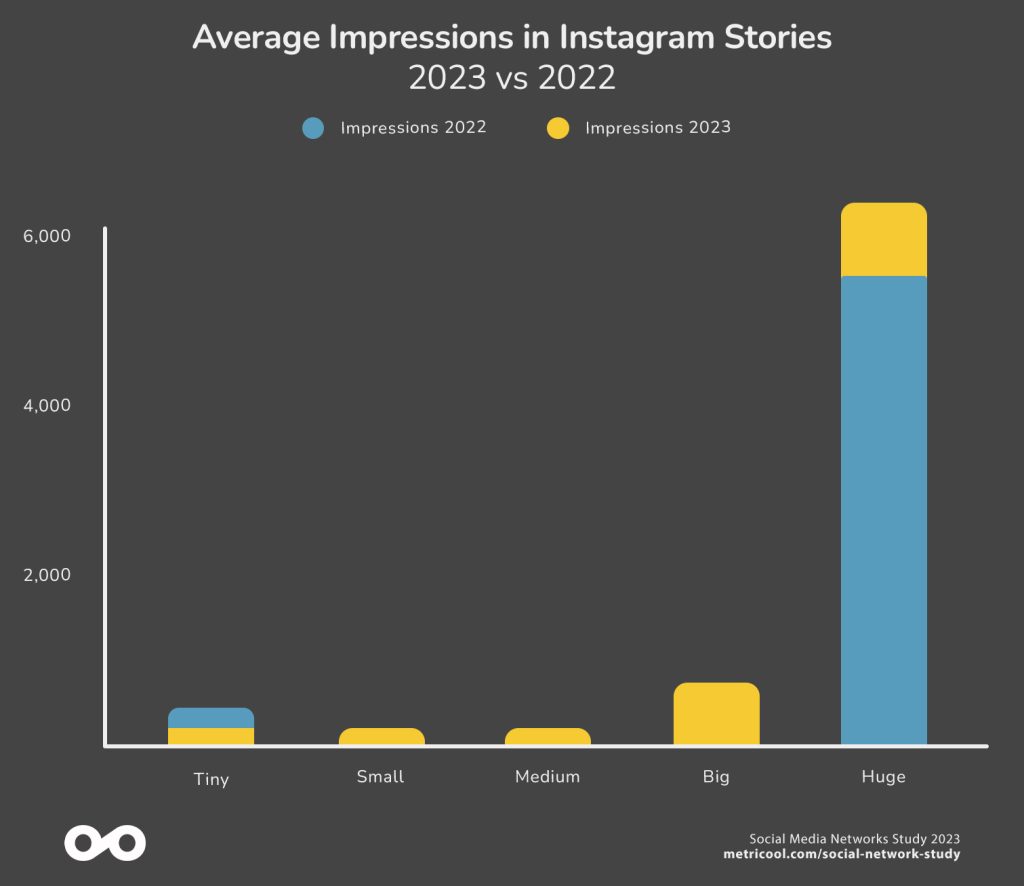
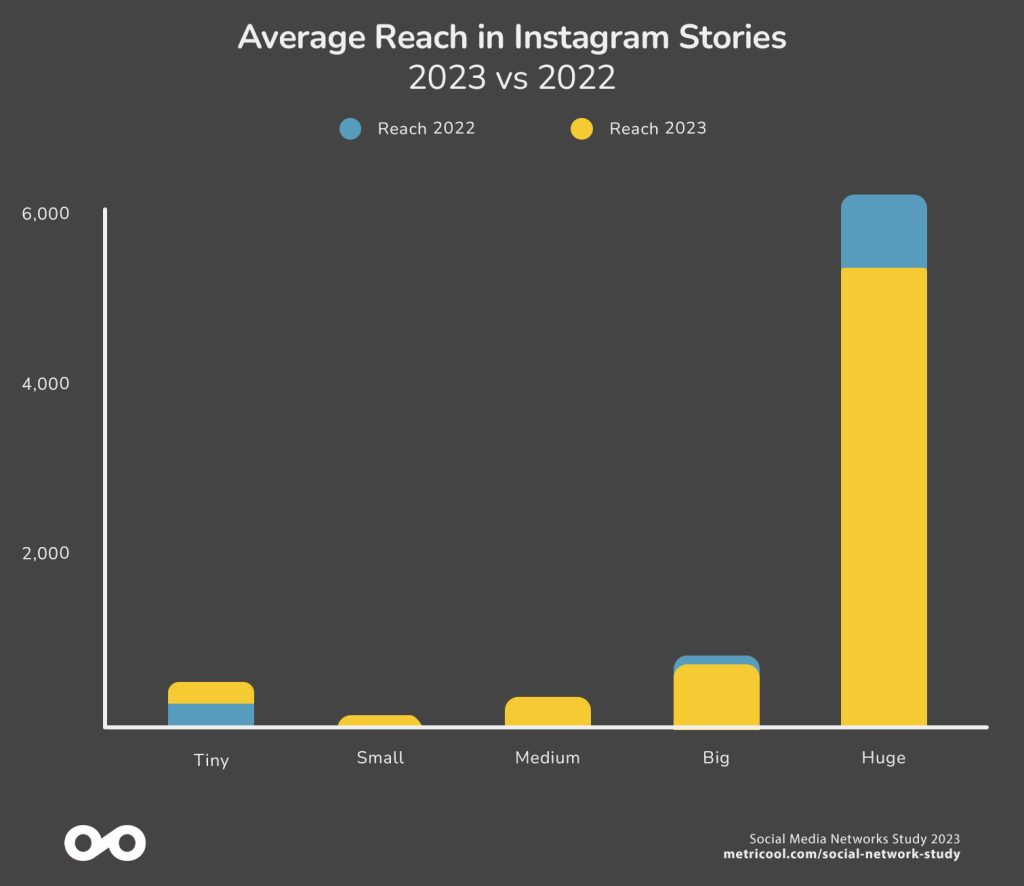
Stories are a hit: reach and impressions are on the rise
Especially in the “Tiny” and “Huge” accounts. The stories format has the highest frequency of publication in relation to posts and reels.
A booming format for smaller accounts.
Frequency of publication has a direct correlation with interactions
The frequency of post publications has dropped considerably, with the frequency of reel publication increasing in all accounts except for the Tiny size.
This decrease can also be seen in the number of interactions received by posts and reels.
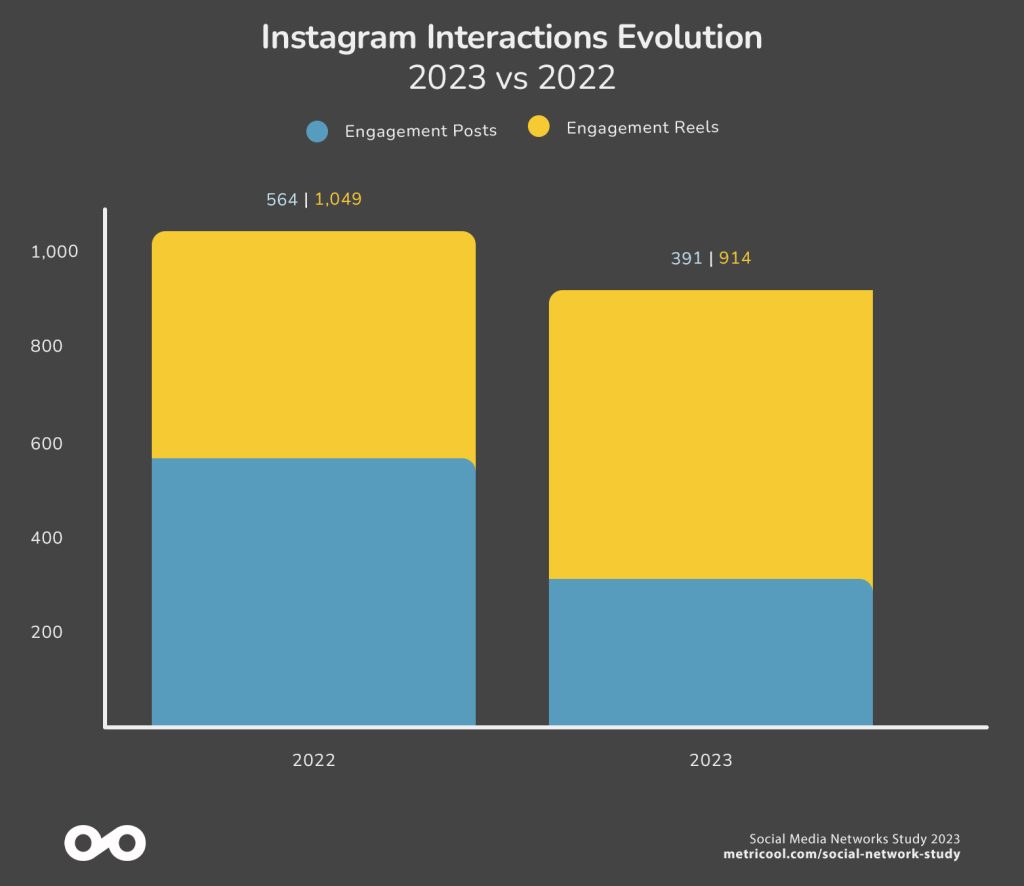
Interactions have decreased in posts. While in reels, the larger accounts, which have also increased the frequency of publications, have benefited. Especially the “huge” ones that have obtained 18.26% more compared to 2023.
| Frequency of Instagram posts per week by size account | 2022 | 2023 | Diference |
| Tiny | 4.7 | 2.1 | -56.6% |
| Small | 3.4 | 2.2 | -35.7% |
| Medium | 12.6 | 3.3 | -73.9% |
| Big | 8.6 | 6 | -31% |
| Huge | 82.3 | 19.6 | -76.2% |
| Frequency of Instagram Reels per week by size account | 2022 | 2023 | Difference |
| Tiny | 0.9 | 0.8 | -14.5% |
| Small | 0.6 | 0.8 | 40.8% |
| Medium | 0.8 | 1.1 | 39.6% |
| Big | 1.3 | 1.8 | 37.6% |
| Huge | 3 | 4.1 | 35.1% |
Instagram trends for 2024
Stories and reels are positioned as the formats with the highest projection for 2024.
This pattern suggests that there is a challenge to retain the attention and engagement of the audience with the reel format, especially for smaller and medium-sized accounts.
Therefore the story format could become an ally for strategies on Instagram for accounts of specific sizes to retain their communities.
Instagram has many more keys: formats such as videos and carousels that we see in detail in the 2023 Instagram study. These are just some headlines, we invite you to see all the details in the following link.
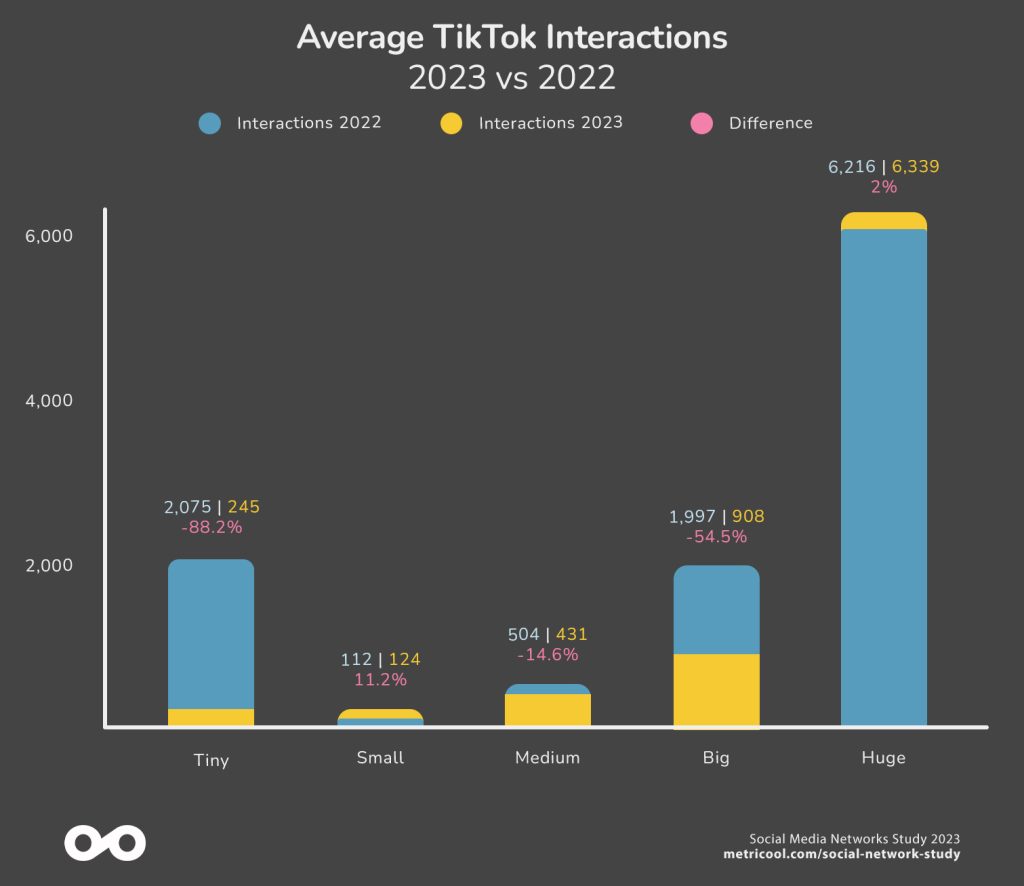
TikTok
We analyze in general terms how Tiktok has evolved in 2023 based on visualizations, interactions and engagement.
| 2022 | 2023 | |
| Accounts | 14,206 | 66,567 |
| Posts | 171,213 | 810,703 |
Things are looking more favorable for larger accounts
If TikTok has been known for anything, it’s been for how easy it was to grow even if you were just starting out on the social network.
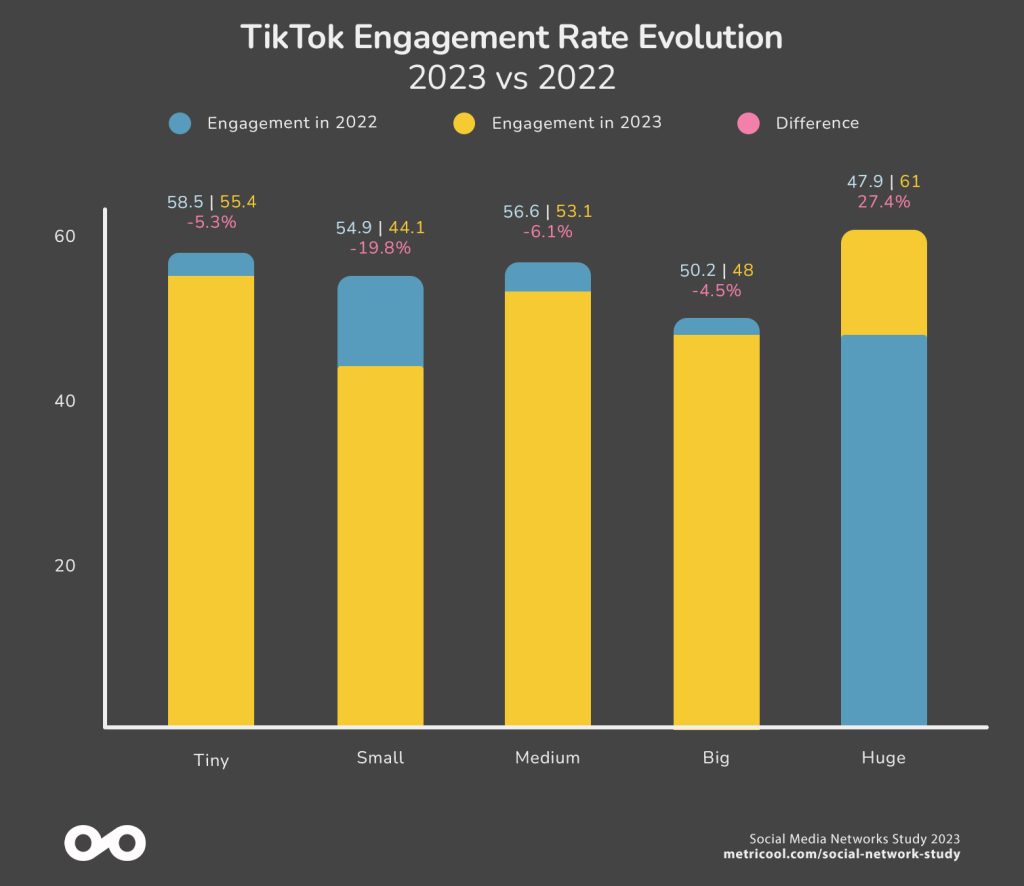
Although we see that the Tiny accounts continue to have good engagement, if anyone is favored, it is the Huge accounts that increase both in engagement and interactions.
Merit for longer videos on the video network
The frequency of publication decreases, except for Big accounts, and the average length of videos increases, with an average of 55 seconds.
So fewer but longer videos.
| Weekly frequency posting | 2022 | 2023 | Difference |
| Tiny | 2.7 | 2.1 | -20.8% |
| Small | 3.4 | 2.9 | -14.5% |
| Medium | 3.9 | 3.4 | -13.8% |
| Big | 4.5 | 4.8 | 7.6% |
| Huge | 7 | 6 | -9.9% |
TikTok Trends for 2024
With the decrease in interactions and average views across various account sizes, the conclusion could suggest a saturation of content on the platform, meaning creators and brands should focus on more effective strategies to maintain audience engagement.
For detailed data and differences between personal and business accounts you can see the complete 2023 TikTok Study here.
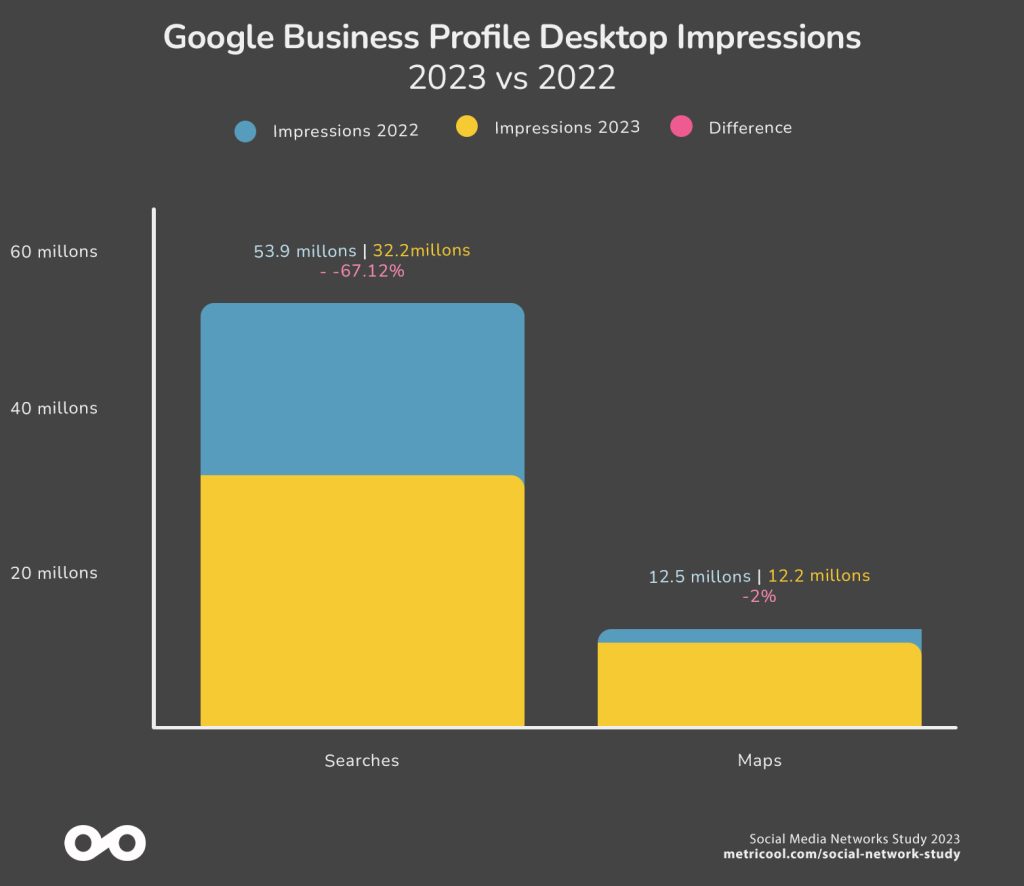
Google Business Profile
Google Business Profile is consolidating its position as the channel to promote local businesses. In addition to facilitating the insertion of businesses in Google searches, it also acts as a social network with publications.
| 2022 | 2023 | |
| Accounts | 83,319 | 86,626 |
Let’s take a look at how GBP has evolved in 2023
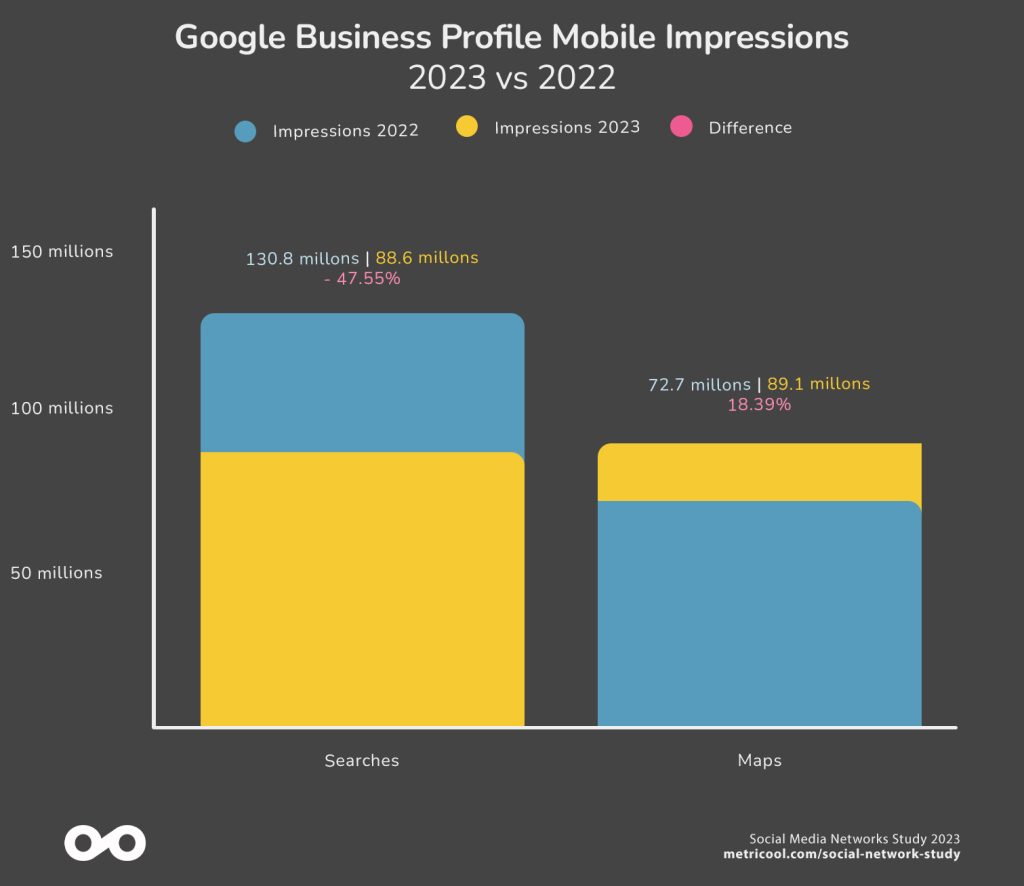
Impressions on mobile and desktop searches reduced
But there is a 22.53% increase in mobile impressions on Google Maps.
This data may show a change in user behavior with respect to searches.
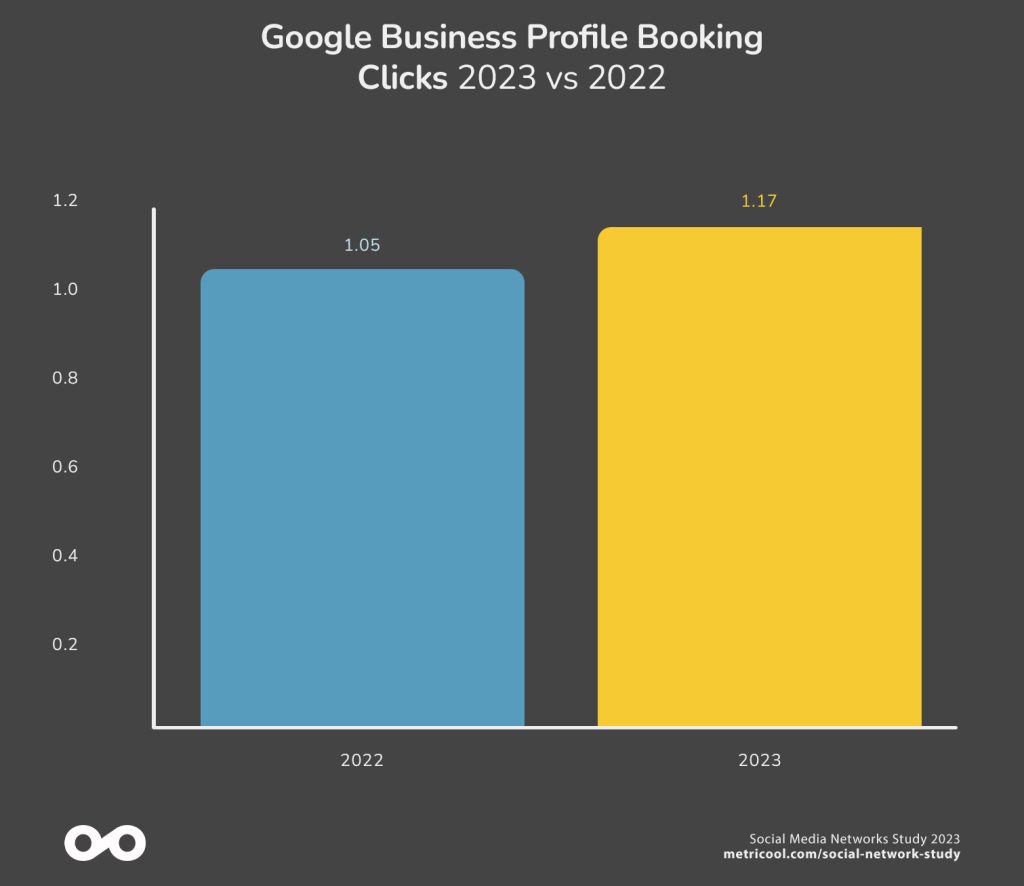
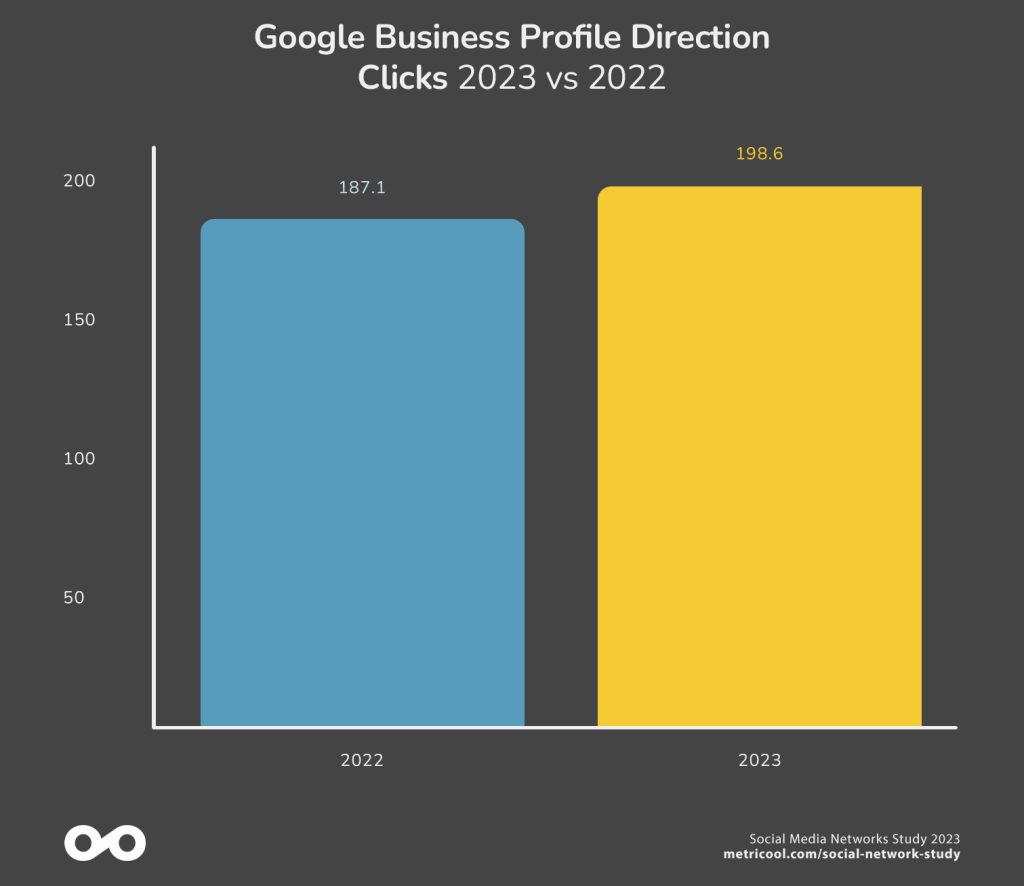
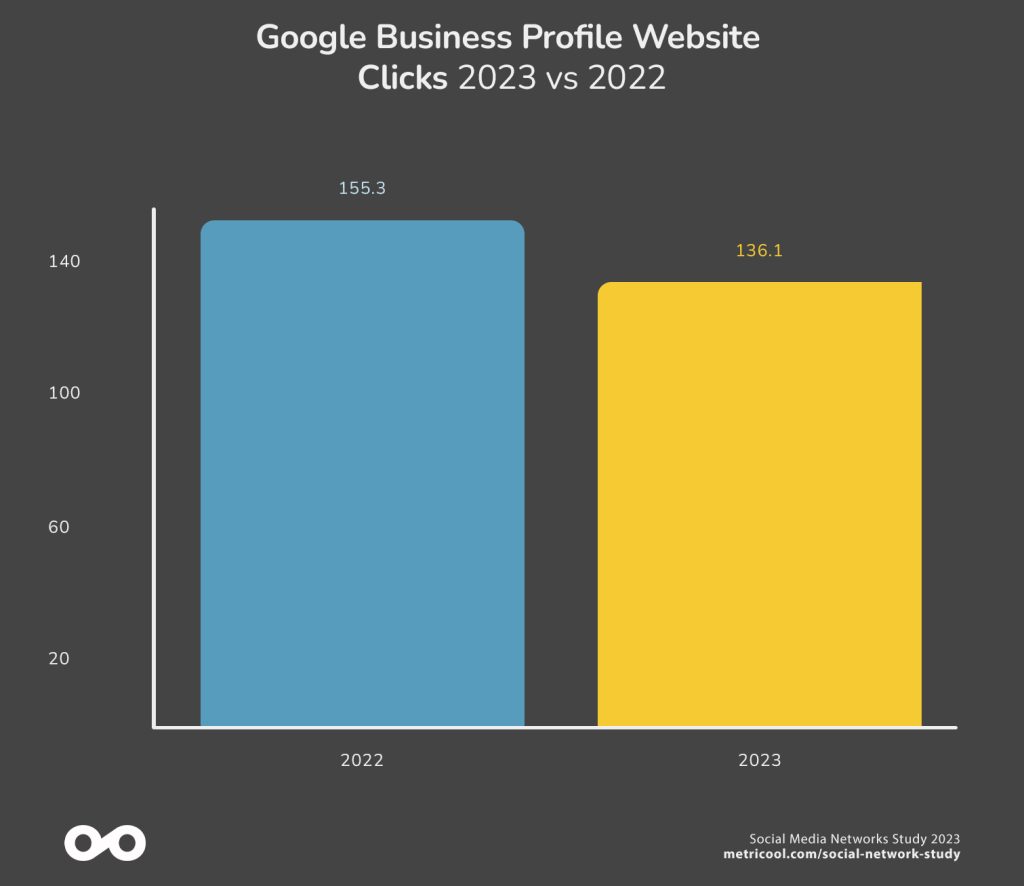
Decrease in website clicks and increase in bookings
The user uses GBP in a map-like environment, so clicks to ask for directions and book are the ones that increase in percentage, while the rest experience a decrease.
And the number of publications is increasing, highlighting the video format
Google Business Profile posts grab more space in Google’s search results. Brands have increased these posts to attract the attention of internet surfers.
| 2022 | 2023 | |
| Photos | 262,630 | 339,412 |
| Videos | 7,551 | 14,129 |
| Posts | 107,588 | 184,993 |
Google Business Profile Trends in 2024
Google Business Profile is the platform to get more direct actions within the search engine. Users are increasingly using these profiles to perform immediate actions without leaving Google, such as making a reservation or asking for directions to the location.
YouTube
The YouTube study analyzes all videos together (both shorts and regular videos). YouTube Shorts launched in 2020, so it does not interfere with the data obtained from 2022 and 2023.
The larger the size of the YouTube channel, the higher the frequency of publication
The posting frequency has increased in all channels, regardless of their size, although the biggest increase is seen in the Huge accounts. The increase in content production has grown by more than 27% compared to 2023.
Does the posting frequency influence the number of followers? We cannot say this 100%, but it is data to take into account.
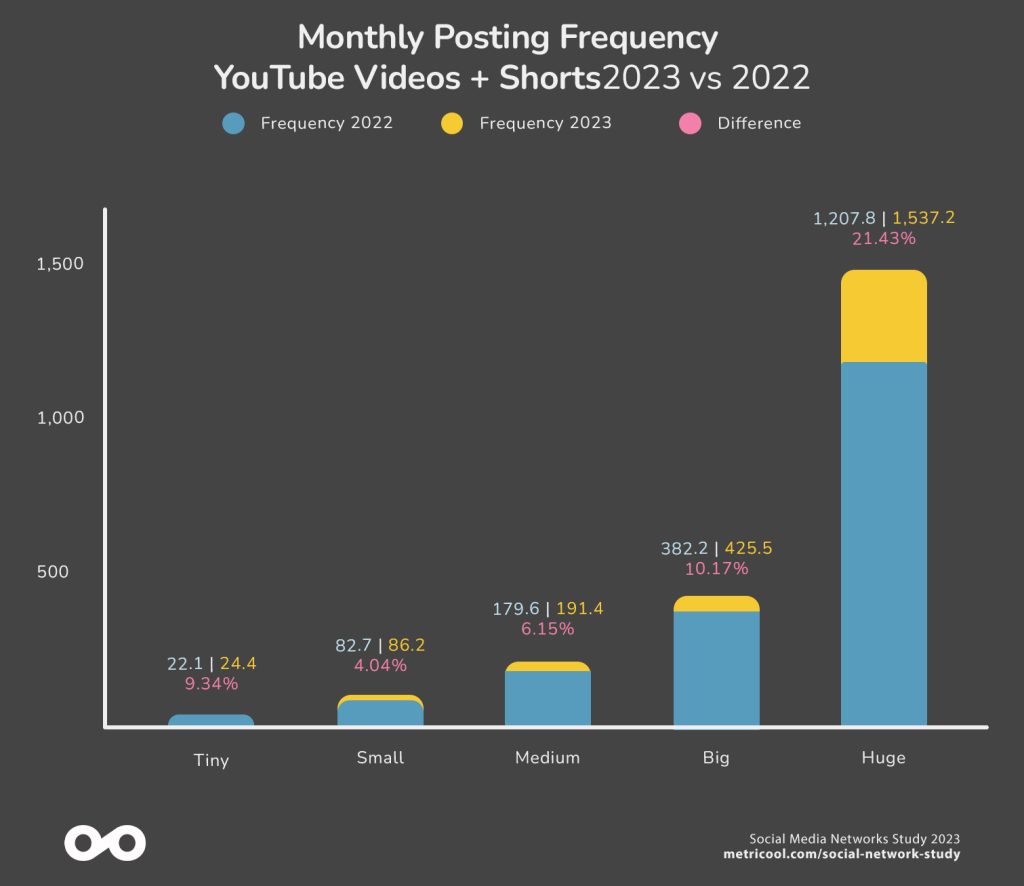
Huge accounts publish an average of 219 videos (shorts and videos) per week as opposed to Tiny accounts which average 3.49 videos per week.
| Weekly posting frequency | 2022 | 2023 | Difference |
| Tiny | 3.16 | 3.49 | 10.31% |
| Small | 11.82 | 12.31 | 4.21% |
| Medium | 25.66 | 27.34 | 6.55% |
| Big | 54.6 | 60.78 | 11.33% |
| Huge | 172.54 | 219.61 | 27.27% |
Decrease in Average Interaction per Video:
Despite the increase in content production, channels of all sizes have experienced a decrease in average engagement per video (except for Tiny accounts). This suggests that, although they are posting more videos, they may face challenges in retaining audience attention and engagement.
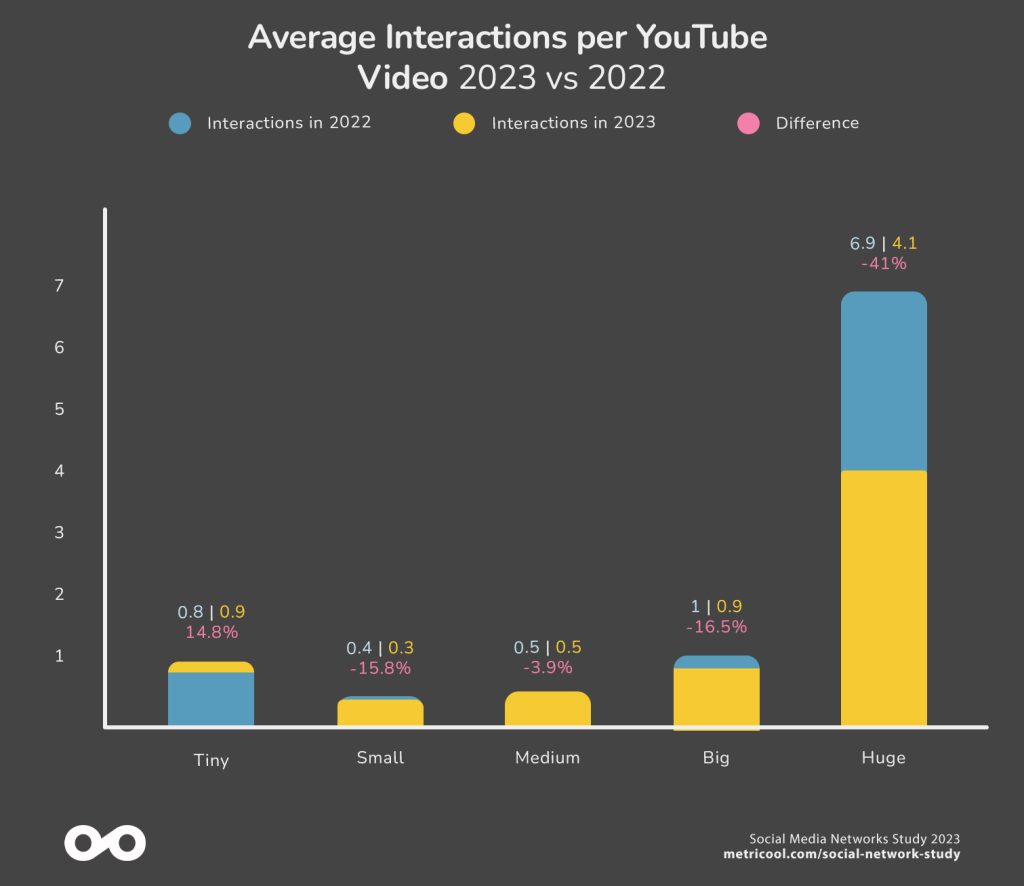
Growth in Video Impressions per Video in Huge Channels:
“Huge” channels have an impressive 69.46% increase in impressions per video. This growth suggests greater visibility and reach for videos posted on this size of channels. These channels are most likely using effective promotion and content distribution strategies to reach wider audiences.
| Average impressions per video | 2022 | 2023 | Difference |
| Tiny | 0.93 | 0.81 | -12.90% |
| Small | 0.32 | 0.38 | 18.75% |
| Medium | 0.50 | 0.52 | 4% |
| Big | 0.86 | 1.03 | 19.77% |
| Huge | 4.06 | 6.90 | 69.46% |
YouTube Trends in 2024
The trend for 2024 is expected to be marked by an even greater focus on quality content and promotion to increase audience interaction and engagement.
Content creators, especially on smaller channels, can benefit from focusing on specific strategies to improve audience retention.
In addition, the significant growth in impressions per video on “Huge” channels highlights the importance of advanced digital marketing strategies, such as SEO optimization, partnerships, and in-platform advertising to maximize visibility.
Social Media Study Methodology
Data collection was carried out over 30 days, September 2023, compared to the same period in 2022.
The accounts and content originate from more than 120 countries, so the results are global and not localized by language or geographic area. All the accounts are business or creator accounts, so the study and conclusions are focused on using social media professionally.
The accounts and content analyzed vary by social network. In each section, the specific data of the sample is attached.
Like all of our Metricool studies, we separate by account size the social networks that give this data, except Pinterest.
To access all the metrics and graphs, download the Data Studio Dashboard.
2024 Social Media Trends Conclusions
More accurate algorithms
The saturation of content in networks is evident, with decreases in interactions and reach. However, engagement is on the rise.
This data indicates that the algorithms, especially in large networks (TikTok, Instagram, and Facebook) are more accurate. As there is more content, they have to do a more efficient job.
Therefore, content appears to those who are most likely to interact with the content, so the algorithms are doing their job well, hence engagement goes up but reach and interactions go down.
Quality vs Quantity
The general trend points to a focus on quality content rather than quantity, especially on Twitch and LinkedIn.
Video Formats on the Rise
Stories, Reels, and Lives are positioned as content formats with positive projections for 2024, with an emphasis on creating engaging, visual content.
Adaptation to algorithm and platform changes:
Adapting to changes in algorithms and audience preferences becomes crucial in maintaining high engagement across all platforms.
Increased engagement in smaller accounts: authenticity is rewarded
While there is an overall increase in posting frequency in larger accounts, engagement is often higher in smaller accounts, highlighting the importance of authenticity and connection.
⬇️ Share the Social Networks 2023 Study ⬇️
