TikTok Study 2026: Formats, Growth, and Strategy
 Blanca Ruiz
12 May 2026
Blanca Ruiz
12 May 2026 
Download the 2026 TikTok Study
Fill out the form and get your free copy
Metricool Software S.L. is responsible for the processing of your data, in order to send you this free resource and communications with news and possible Metricool promotions, unless you want to unsubscribe at any time. You have the right of access, rectification, deletion, limitation and opposition to processing and portability. You can exercise your rights at [email protected]. More information in the Privacy Policy.
TikTok is the queen bee of the social media universe, but is its leadership truly untouchable, or are the first cracks starting to show?
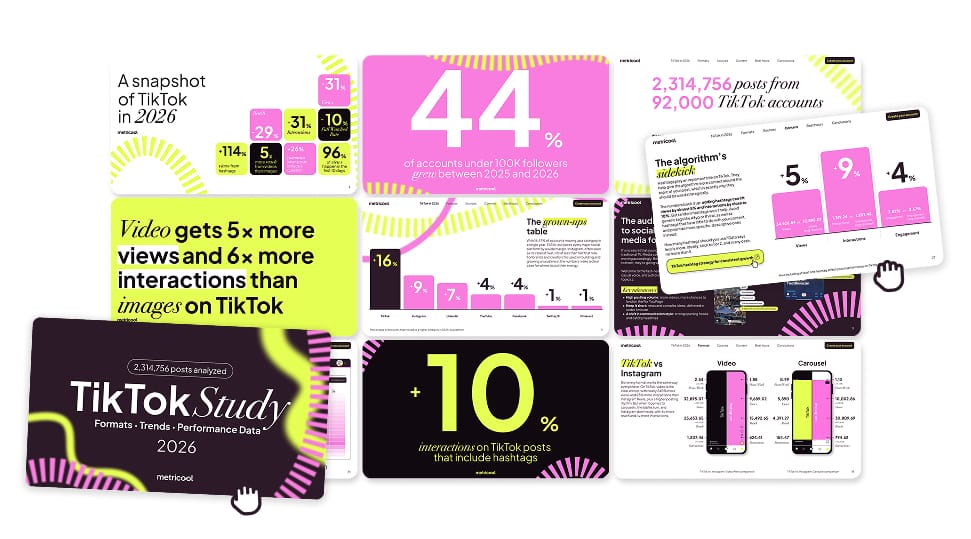
To find out, we analyzed 2,314,756 posts from more than 92,000 accounts worldwide to create a report that truly represents the current state of the platform: what works, the trends, and how you can use them in your strategy.
We dug into the data to find answers to questions such as:
- Which format performs better on TikTok: videos or carousels?
- How much say does the algorithm really have in your content’s performance?
- Do hashtags still make a difference?
- Does video get better results on TikTok or Instagram?
- What are the strategies helping small businesses on TikTok?
Download the full study for free and explore strategies, trends, and formats that work in 2026, backed by data.
For this study, we looked at accounts of all sizes across a wide range of industries to get a firsthand look at how people are using TikTok.
Here’s a sneak peek of what’s inside:
- Growing on TikTok: 44% of accounts under 100K followers grew between 2025 and 2026
- Content volume: +72% videos and +140% image/carousels published by Metricool users
- Format comparison: Video gets 5x more views and 6x more interactions than images
- How to get discovered: The For You Page drives 7 out of every 10 views
Get the TikTok Study 2026 now and read all the details:
Download the 2026 TikTok Study
Fill out the form and get your free copy
Metricool Software S.L. is responsible for the processing of your data, in order to send you this free resource and communications with news and possible Metricool promotions, unless you want to unsubscribe at any time. You have the right of access, rectification, deletion, limitation and opposition to processing and portability. You can exercise your rights at [email protected]. More information in the Privacy Policy.
