Advanced Social Media Reports with AI
The report you need, from a single question
Forget opening 15 tabs just to finish your monthly report. Describe what you want to analyze and Metricool Studio gives you the data, charts, and clear next steps.
+3.5 million professionals already trust Metricool

Metricool Studio: more powerful than traditional reports, easier than Looker Studio
Ask what you want to know. Metricool Studio finds it in your data and delivers it as a report. In any language, with guided or expert mode.
01
Ask like you would a teammateWrite what you need naturally, in any language. Start with guided mode if you want step-by-step help, or go straight to expert mode if you already know what you’re looking for.
02
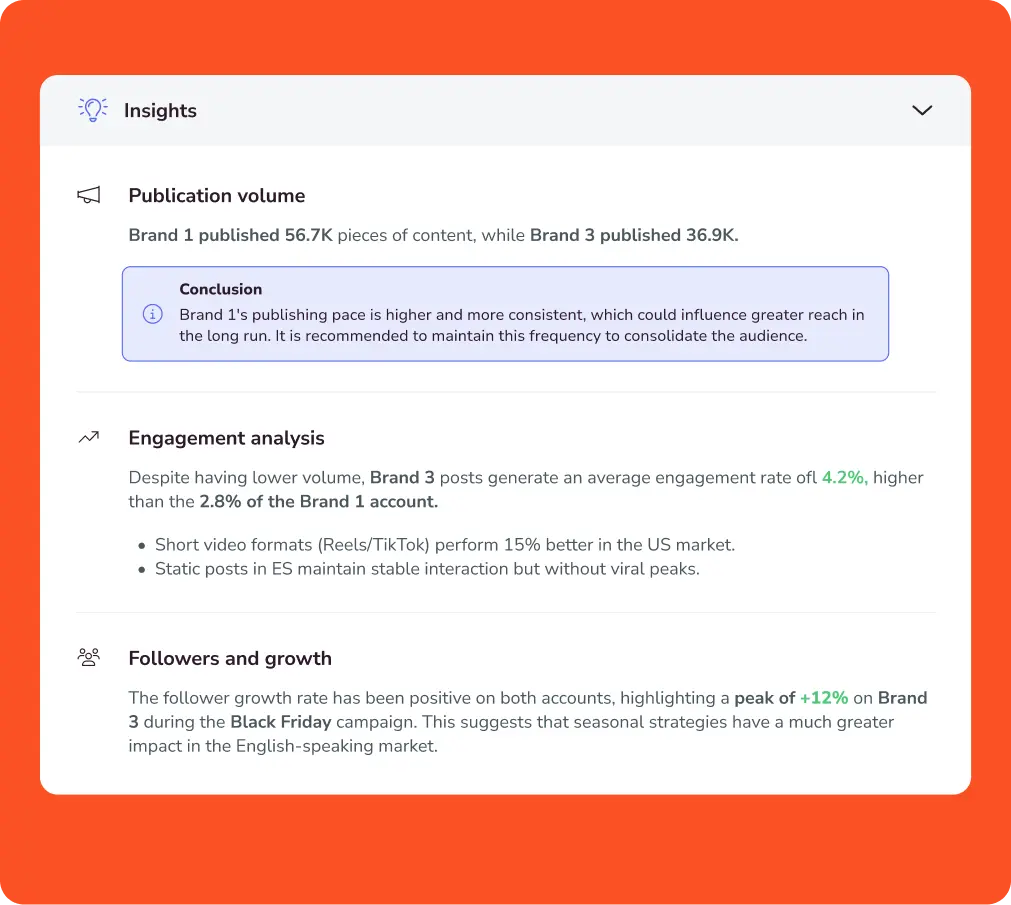
Not just data: get clear next stepsMetricool Studio goes beyond charts. Every report includes an executive summary based on your data, ready for your client or team, plus actionable takeaways: what happened, why it matters, and what to do next. The part that spreadsheets and dashboards usually miss.
03
Built around you. Choose your dataTell it which metrics to include and how to display them in the report, whether you want bar graphs, line graphs, tables, or text blocks. Whatever helps you understand everything at a glance.
04
Share with anyone, no logins neededSend a live URL to your client, team, or manager. If you request the report for “this month” or “this week,” the link stays the same and updates automatically. They open it every Monday and see fresh data. No screenshots, PDFs, or resending.
How AI Reports Work
Analysis matters for every strategy.
Spending hours gathering data doesn’t.
01
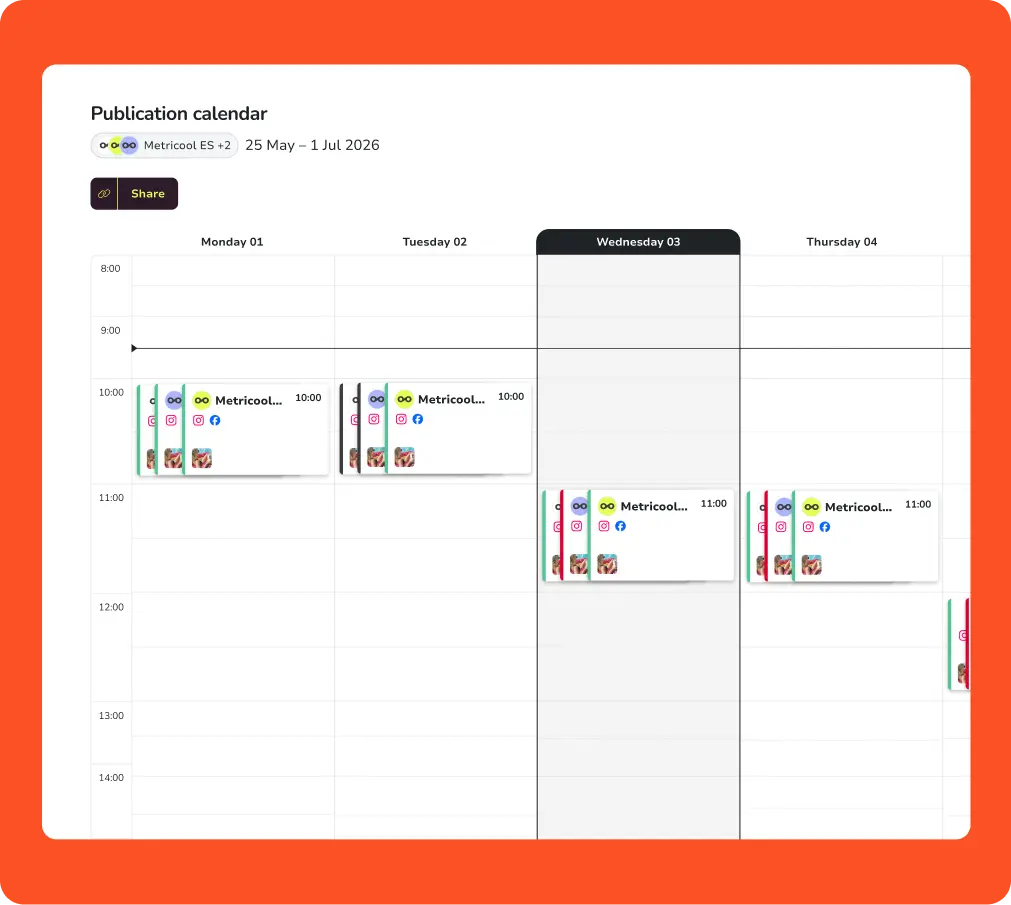
Share the weekly calendar with your client without having to create a PDFEvery Monday, you manually create a PDF in Canva with the scheduled posts and send it to the client. If there are changes, you redo it. With Metricool Studio, you generate the report and share it via a public link. The client opens it on their phone without logging in. The link updates automatically.
“Generate a Calendar report with all the content scheduled for the coming week across these brands and networks.”
02
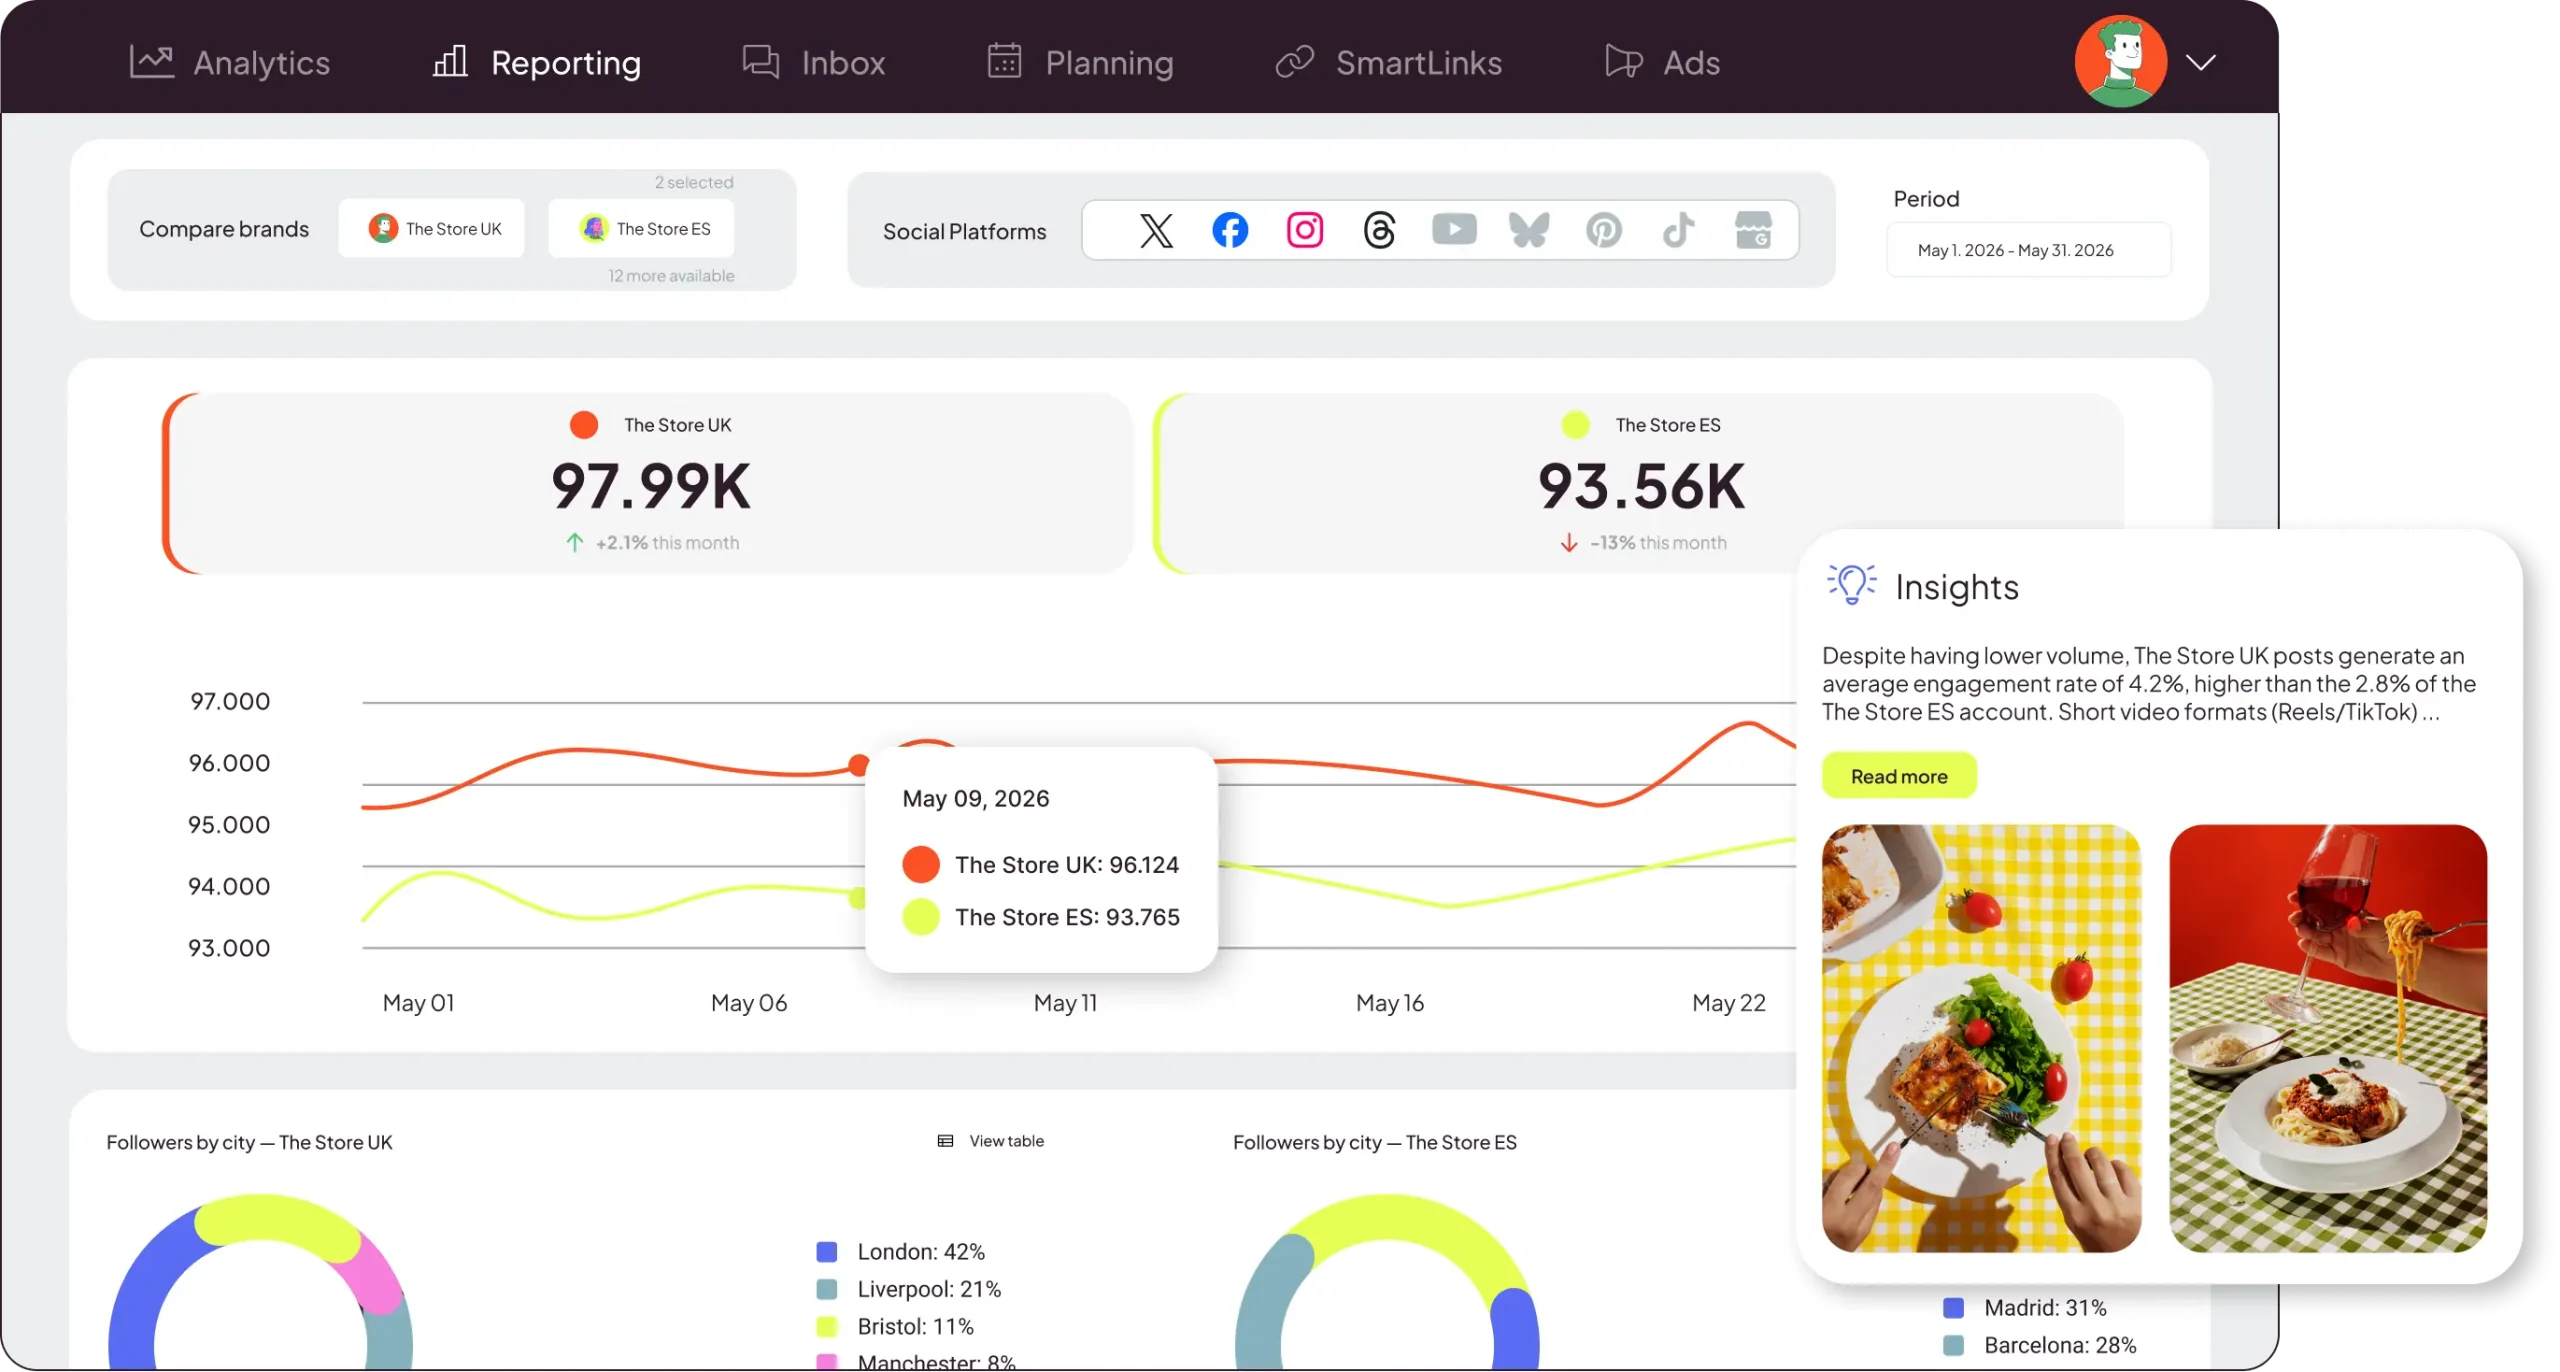
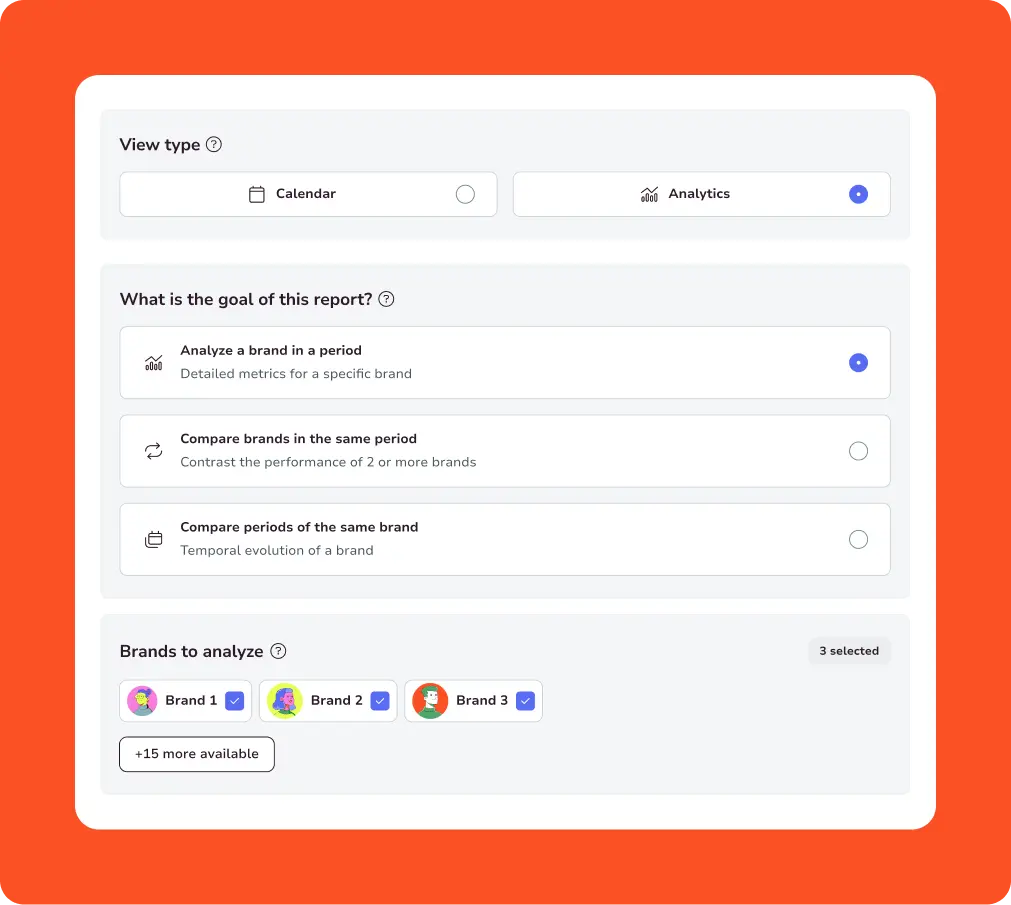
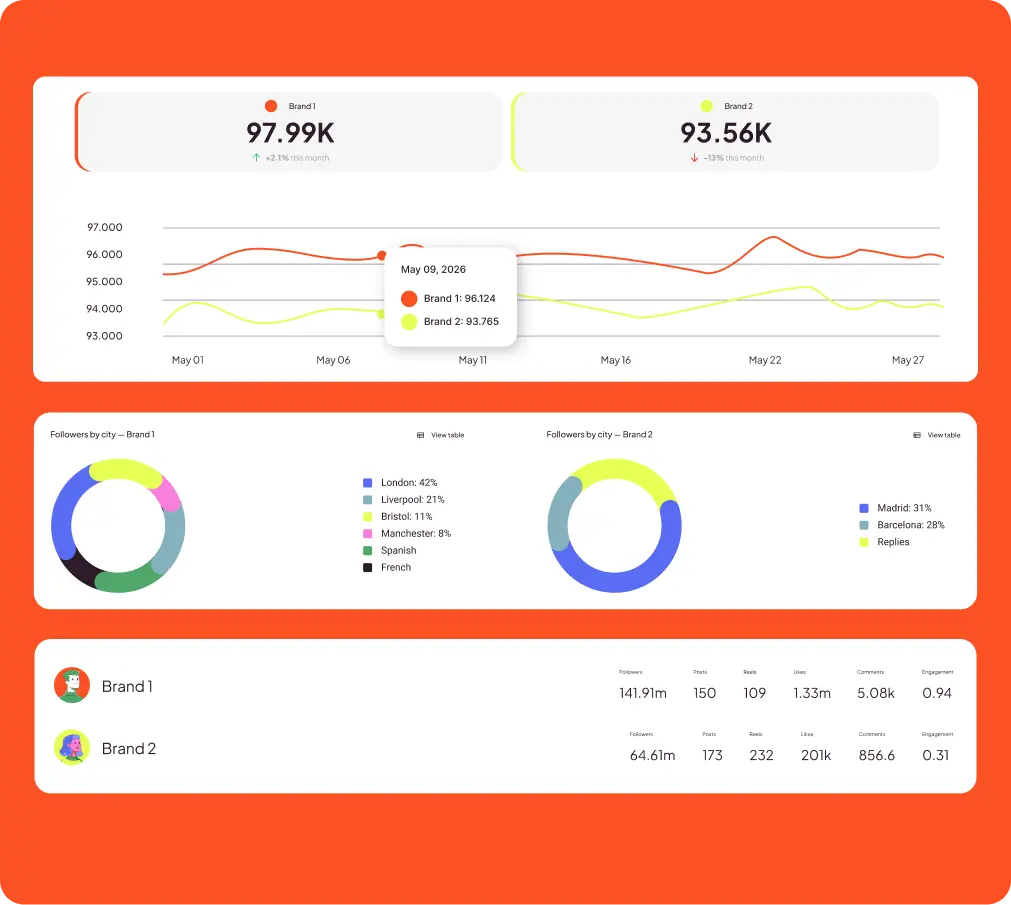
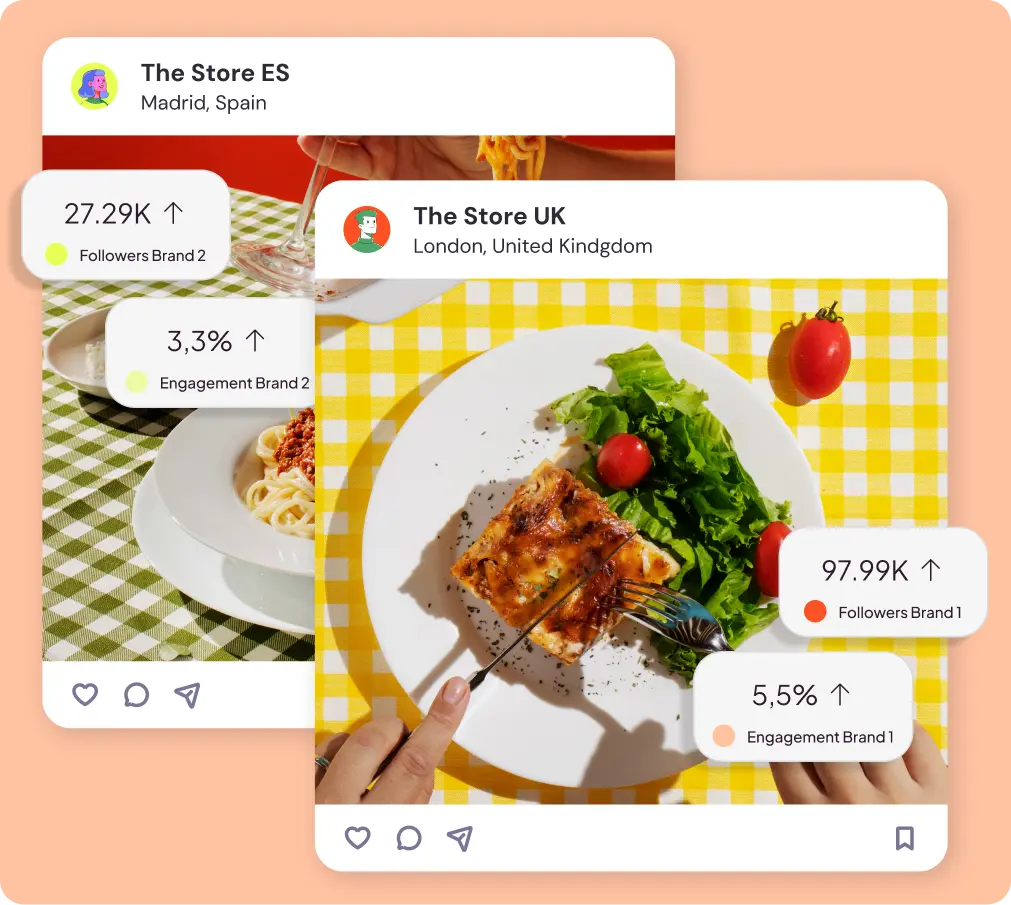
Show up to the meeting with the analysis already interpreted, not with yet another Excel spreadsheetEvery month, you have to compare three brands for the meeting with the account director. Data exported manually, copied into Excel, charts created one by one. With a single command, you get the complete comparison: charts, executive summary, and insights on what one brand can learn from the others.
“Compare these brands over the same period. Show me charts of followers, reach, and top posts, and include conclusions on what each brand can learn from the others.”
03
Discover what your competitors are doing that you aren’tComparing your Reels to those of your competitors used to be a manual process: checking other profiles, noting down metrics, and comparing them with your own. Now it can be done with a single command, and the result is concrete patterns—which formats work best, what length, and what frequency.
“Analyze these competitors’ Reels from February and tell me what’s working best, including my account.”
04
Know when to post based on your content, not your industryThe “best times to post” you see today are based on industry studies—not on the actual content of your account. Metricool Studio analyzes all your published posts and Reels and identifies specific patterns for your audience. You go from “the best times based on averages” to “the best times based on my data.”
“Analyze all the posts and Reels we’ve published and identify the best days and time slots by platform, based on average engagement.”
Here are a few ways Metricool Studio helps you work faster, not harder
(and we have templates with ready-to-use prompts)
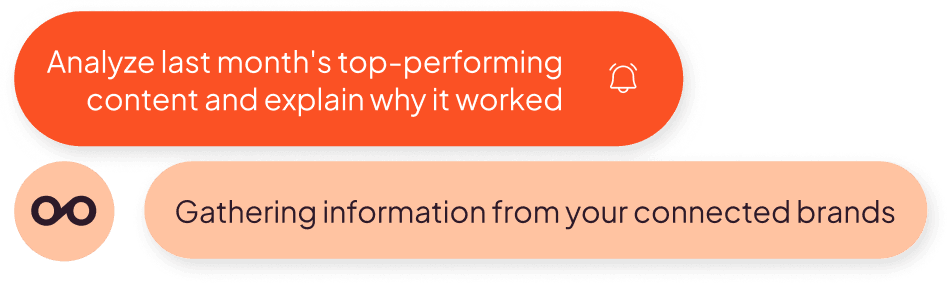
Connect your brands, let Metricool collect the data, and start asking better questions
Choose the report you need today from the reporting tab

Your usual report (on autopilot)
Monthly performance reports per brand, ready to send automatically to your team or clients.

Campaign analysis
Group campaign content across platforms with Campaign Dashboards, measure real performance, and get insights to understand what worked.

AI reports
Ask what you want to analyze and Metricool Studio builds the report for you. Great for comparing brands across languages or locations, creating tailored reports and calendars for clients, or generating content ideas from your top posts.

The most complete interactive report
For teams that need everything in one place
Import your social media data into Looker Studio with our connector and combine it with over 250 data sources.