How to See TikTok Analytics and Create Custom Reports in 2026
 Kata
10 June 2026
Kata
10 June 2026 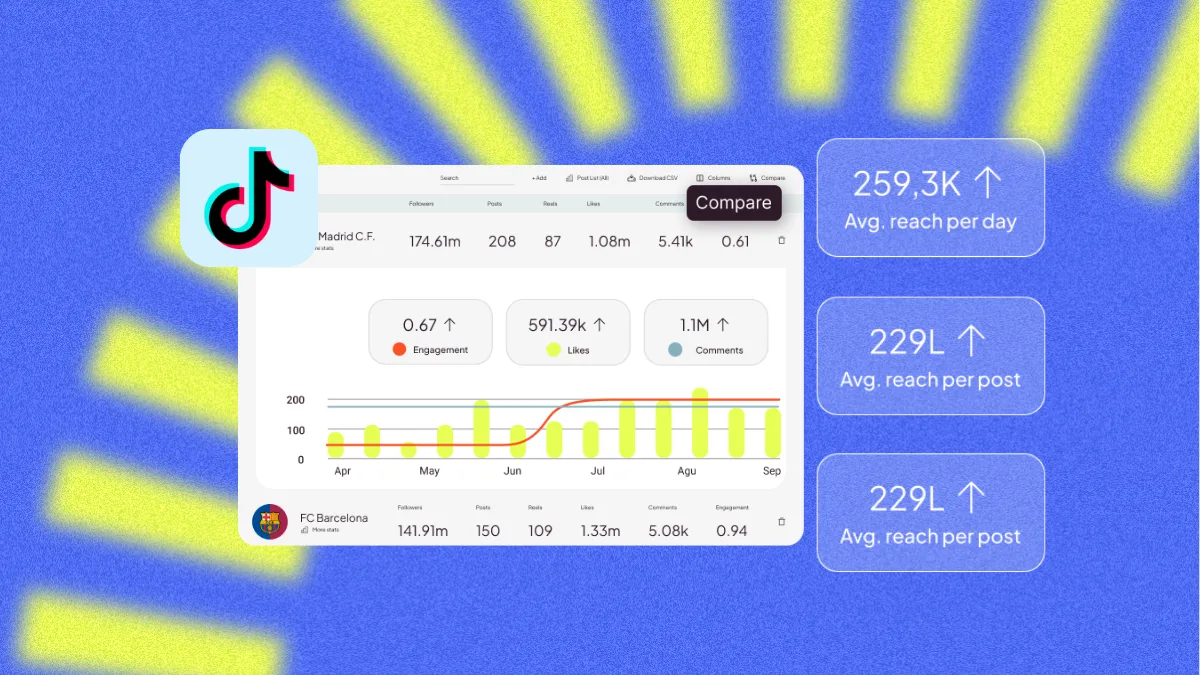
TikTok’s growth isn’t hitting the brakes, boasting over 1.04 billion monthly active users worldwide. If you’re a creator or you’re managing a brand, understanding how to see TikTok analytics is crucial for measuring performance and strategizing content effectively. In this guide you’ll learn how to access TikTok analytics and generate detailed TikTok analytics reports.
How to Access TikTok Analytics
Before diving into the data, make sure your account is set up to show it. Here’s how:
- Switch to a Pro Account: Go to your profile, tap the three-line menu, select “Settings and privacy” → “Account” → “Switch to Pro Account”. It’s free and takes less than a minute to set up. By doing this, you unlock the analytics features.
- Open your Analytics Dashboard: Head back to your profile, tap the three-line menu, select “Creator Tools” → “Analytics”. You’ll land on three tabs – Overview, Content, and Followers – and that’s where the good stuff lives.
What Are TikTok Analytics Reports?
TikTok analytics reports are social media reports that measure a brand or creator’s marketing strategy, KPIs, and content performance. It’s essential for tracking growth, spotting areas for improvement, and benchmarking against competitors.
TikTok’s native analytics cover the basics, but if you want flexibility, automation, and cross-channel data in one place, tools like Metricool take it further. Metricool offers three reporting options depending on what you need:
- Standard reports: automated monthly reports combining organic and paid data
- Campaign Dashboards: group all content from a specific campaign across platforms and analyze it together
- Metricool Studio: AI-powered reports generated from a simple question, no manual setup needed
More on each of these below.
11 Key TikTok Analytics to Measure
On TikTok specifically, reports can track organic and paid advertising to analyze the full scope of your brand’s marketing efforts. These main metrics include:
Organic TikTok Analytics
Understanding these metrics is essential for evaluating your content’s performance:
- Follower balance: Measures your profile growth, tracking lost and acquired followers. While followers aren’t the most important metric, this can indicate your active audience on the app.
- Profile views: Track the number of users that have viewed your profile, a metric that can leverage your brand visibility.
- Video views: A fundamental metric to evaluate your video performance. Video views help track a video’s potential reach and popularity among viewers. Higher video views also indicate prioritization on TikTok’s algorithm.
- Video engagement: Average watch time and completion rate are the two key indicators of video engagement. The goal is to retain and engage viewers throughout the video, so monitor drop-off moments to identify content improvements.
- Engagement rate: Along with video views, the engagement rate gauges how viewers resonate with the video. This is measured by the number of likes, shares, comments, and saves compared to the video’s reach.
- Audience demographics: Factors like age, gender, location, and interests describe your audience and how you can better target them.
Paid TikTok Analytics
- Ad impressions: Tracking the number of times your ad has been shown on screen, impressions are key for understanding your campaigns’ reach and potential audience.
- CPM (Cost per thousand impressions): Indicating the cost an advertiser pays to reach one thousand impressions, this helps advertisers understand the cost and reach of their ad campaigns.
- CPC (Cost per click): Like CPM, CPC is how much advertisers are willing to pay for each ad click. This helps advertisers understand the cost-effectiveness of their ads and measure ROI.
- CTR (Click-through rate): CTR is the number of clicks your ad receives divided by the number of times your ad is shown. A higher CTR rate signifies a successful campaign with a positive website, shop, and content traffic.
- CVR (Conversion rate): Measures the percentage of ad visitors who take a desired action on a website, app, or shop. CVR measures the strength of the campaign’s call to action.
How to Create Native TikTok Reports
TikTok lets you download data and build custom ad reports through TikTok Ads Manager, but there’s no way to combine organic and paid results in a single native report. If you want everything in one place, scroll down to the Metricool section.
Download TikTok Analytics Data from Business Hub
Inside TikTok Business Hub, you can analyze your organic results going back up to a year. Just hit Download data at the top of any page to export in XLSX or CSV format.


The downside? Business Hub doesn’t have a built-in reporting feature, so you’d need to transfer that data manually and build your own report from scratch, which takes time and leaves room for error.
A reporting template can help you skip the blank page and make sure you’re not missing any key metrics each month:
Create Reports with TikTok Ads Manager
Ads Manager is TikTok’s native advertising hub, offering campaign building, creative and management tools, and analytics. Custom reporting allows advertisers to analyze their TikTok campaign results. To access TikTok Ads Manager, create an account at the Advertising on TikTok page.
Once inside, head to the Analytics tab and click Custom reports. You have two ways to build your report:

Build from scratch: Choose your own metrics and dimensions. Dimensions cover things like account name and ID, campaign details, ad information, targeting selections, product IDs, and more. For metrics, you can start with the basics (CPC, CPM, impressions, clicks, CTR, conversions) and layer in video play data, engagement, product data, in-app events, shop events, and offline conversions.
Build from a template: Pick a ready-made focus:
- Ad group performance
- Ad performance
- TikTok Shop performance
- TikTok Shop product performance
- Catalog product performance
Once your report is configured, choose how you want to view it – Pivot table or Trend line – set your time range, and hit Save. Then choose your delivery method:
- Scheduled Running: set it and forget it; reports arrive automatically on your chosen schedule
- Run & Export: generate and download the report immediately

TikTok Reports with Metricool: 3 Ways to Analyze Your Results
TikTok’s native reporting splits organic and paid into separate silos; there’s no built-in way to see them together. Metricool fixes that, and takes it further. Here are the three reporting options available, each suited to a different need:
1. Standard Reports (automated monthly reporting)
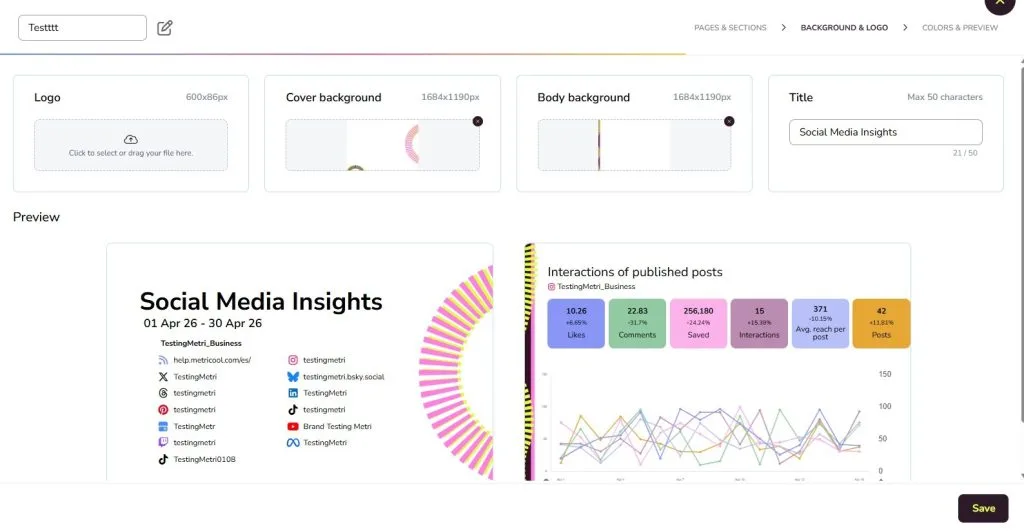
Metricool’s classic reporting combines organic and paid TikTok data in a single, fully customizable document. Set it up once and it runs itself. Here’s what you can configure:
- Period: analyze data month by month, compared to the previous month’s results
- Language: select from over 10 languages
- Template: choose a previously made template or create your own (available for Advanced and Enterprise accounts)
- Sections: toggle which networks and metrics to feature
- Logo: add your brand or client’s logo
- Generate: download in PDF or PPT
- Automatic monthly report: send reports automatically to yourself, a client, or a team member every month
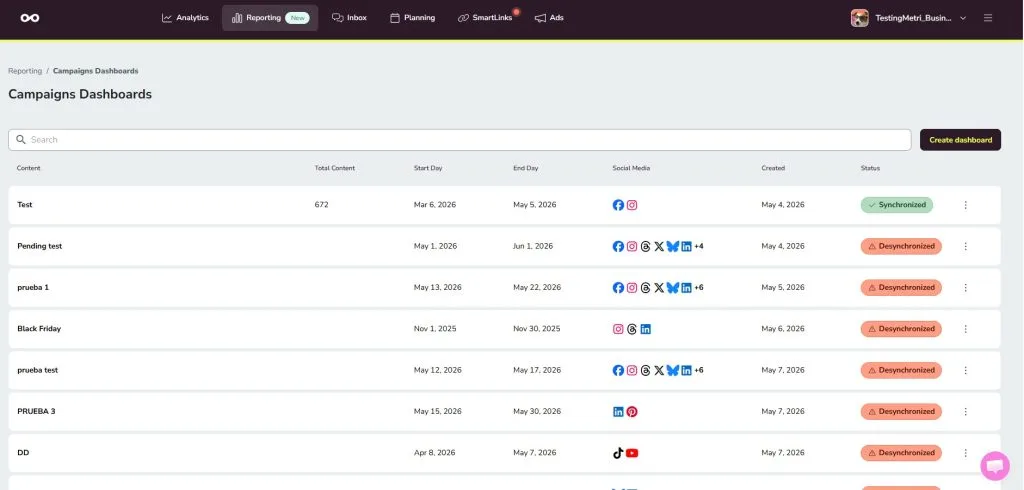
2. Campaign Dashboards: Analyze TikTok as Part of a Bigger Campaign
Running a TikTok campaign alongside ads or content on other platforms? Campaign Dashboards let you group all related content (TikTok organic posts, TikTok ads, and activity across other platforms) and analyze everything together in one place.
Instead of piecing together results from TikTok Ads Manager, Instagram, and other channels separately, you tag content to a campaign while scheduling and Metricool combines the results automatically. AI support then helps you interpret what worked and what didn’t.
This is especially useful after a product launch, seasonal campaign, or influencer activation – any time you need a clear picture of cross-platform performance in a single report.
3. Metricool Studio: AI-Powered TikTok Reports
If you want to go beyond standard reports, Metricool Studio lets you generate custom analyses from a simple question – no manual setup required. Just describe what you want to know and Metricool Studio finds it in your data, builds the charts, and suggests clear next steps.
For TikTok specifically, you could ask things like:
- “Which of my TikTok videos got the most engagement last month and why?”
- “What’s the best day and time to post on TikTok based on my own content?”
- “Compare my TikTok organic performance with my paid campaigns this quarter.”
- “Which content format is driving the most profile visits — videos, carousels, or livestreams?”
Reports generated in Metricool Studio can be shared via a public link (no login needed for the recipient) and update automatically, so you never have to rebuild them for a client.
Campaign Dashboards and Metricool Studio are currently available as a free add-on, with plans to become a paid feature for Starter and Advanced plans.
Data Included in Metricool’s TikTok Analytics Reports
What data can you analyze with Metricool’s TikTok reports? Here is a list of data points included for organic and ad results:
Organic TikTok Data Metrics:
- Community growth
- Profile views
- Video views
- Likes
- Comments
- Shares
- Demographics
- Engagement
- Average reach per post
- Ranking of posts

Under the main results, view how the metric has changed compared to the previous period. This identifies key growth results.
Paid TikTok Data Metrics:
- Impressions
- Clicks
- Conversions
- CPM
- CPC
- CTR
- Cost
- Ranking of campaigns
Understand the impact of your ad campaigns in the period and see individual campaign results in the ranking list, helping you identify which campaigns to replicate.
Social media reports are essential for measuring growth, benchmarking organic and paid results, and tracking KPIs and marketing objectives. Manual reporting can delay thorough analyses and take away from other tasks.
With standard reports, Campaign Dashboards, and Metricool Studio, you have everything you need to turn TikTok data into clear, actionable insights; whether you’re reporting to a client, presenting to a team, or just figuring out what to post next.ce their strategies and content, with guaranteed in-depth data.
Create your account here to get started and improve your measures:
