

How to Generate Custom YouTube Reports
 Carlos Bravo
30 July 2026
Carlos Bravo
30 July 2026 
If you’ve found yourself reading this article, allow me to make an assumption about you: you’re sick of manually creating YouTube reports every week, right? Well, your Groundhog Day nightmare is now officially over.
To build a sustainable social media video reporting strategy, you need a flexible YouTube analytics tool that centralizes performance tracking and automates report assembly. That’s exactly what we’ve created with Metricool Studio. The process of generating custom YouTube reports has become a simple interactive conversation. With natural language prompts, you can transform complex channel data into visual dashboards and executive recaps in seconds. This guide provides a complete walkthrough for connecting your channels, mastering prompt-driven reporting, and automating your regular client presentations without technical stress.
Metricool Studio X YouTube
Metricool Studio is an AI-powered visual reporting and data analysis environment integrated directly into the Reporting framework of the Metricool platform. Designed to bridge the gap between complex raw metrics and clear executive updates, this specialized tool replaces traditional manual chart builders with a prompt-driven workspace.
Instead of requiring you to configure complex database filters, arrange chart axes by hand, or build custom pivot tables, Metricool Studio features an advanced language-processing engine powered by Claude. This technology allows you to interact with your channel statistics using plain, conversational text.
You simply type out a natural description of the exact visual layout, date comparison, or metric breakdown you want to examine. The platform then scans your historical channel logs and constructs a customized Analytics View in seconds. Each view includes interactive line graphs, comparative data grids, and written text recaps that explain what changed across your channel, why those changes occurred, and what actions your team should take next.
How Metricool Studio and YouTube Work Together
By linking your YouTube channel directly to the same workspace that monitors your broader organic social updates, community inboxes, and paid advertising accounts, the platform removes the operational frustration of managing disconnected analytics software. The prompt-led Metricool Studio workspace allows you to completely bypass manual spreadsheet formatting, instantly transforming raw platform statistics into clear, executive-ready presentation assets based on simple text descriptions.
Connecting Your YouTube Channel to Metricool Safely
If you’re not already a Metricool user, you’ll need to connect your youtube account to the platform before you can generate custom reports. If you are already a member, with a connected YouTube account, you can skip this section.
Follow these steps to establish a secure link and begin recording your performance data:
- Navigate to your profile connections: Log into your Metricool account, click on your avatar in the top right corner, and select the specific Brand workspace you want to configure.
- Select the YouTube integration: Click on “Connections” in the left-hand navigation sidebar, locate YouTube in the network list, and click the “Connect” button.
- Authorize permissions via Google: A secure Google pop-up window will open. Log into the Google account associated with your YouTube channel. If your channel is managed under a Google Brand Account, ensure your user profile holds Primary Owner or Owner permissions to complete the integration.
- Grant access options: Check all required permission boxes to allow Metricool to retrieve analytics figures and support automated post scheduling. Click “Continue”.
- Select your specific channel: If your Google profile contains multiple channels, select the correct channel name from the list to finalize the connection.
Once authorized, your dashboard will display a green confirmation indicator. The platform immediately begins retrieving your public and historical data, laying the foundation for your custom reporting builds.
Step-by-Step: Creating Your Custom YouTube Report
With your channel linked and gathering data, you can build a customized presentation dashboard tailored to your team’s tracking goals. Follow this practical workflow to turn raw channel statistics into a clear visual report.
- Open the Metricool Studio workspace: Log into your main dashboard, click on “Reporting” in the top horizontal menu, and select “Metricool Studio” from the left sidebar.
- Select creation method: Choose whether your immediate reporting goal is best served by Guided Mode or Expert Mode. For standard monthly client updates, Guided Mode offers a fast, reliable setup. If you are reviewing a specific video sponsorship or comparing long-form video results against YouTube Shorts, pick Expert Mode.
- Write a precise prompt: The quality and depth of your generated report depends on the detail provided in your prompt. Avoid vague instructions like “show my video stats.” Instead, include clear date parameters, state your primary channels, and specify the exact metrics you want to evaluate.
- Generate and review your custom report: Click the “Generate View” button to begin processing. The system builds your custom report in the background, allowing you to navigate to your content planner, respond to comments in your inbox, or leave the app entirely. A top menu notification will let you know as soon as your completed Analytics View is ready.

Your completed view will display clean visual charts, organized data grids, and an AI-written text summary. The text analysis highlights the reasons behind performance shifts, identifying which thumbnails, topics, and upload times drove genuine channel growth.
Customizing, Refining, and Sharing Your Shared Reports
Once Metricool Studio generates your custom analytics view, the output remains fully interactive and editable, allowing you to tailor the final presentation to your agency’s exact specifications.
Editing Automated AI Insights
While the built-in language processor delivers accurate data interpretations, you might want to add personalized agency context before sending a report to an external client. Every AI-generated text block is fully editable. You can easily click directly into text fields to add custom notes, explain unique campaign goals, clarify a seasonal dip, or align the tone with your agency’s brand voice.
Saving Prompts and Reusing Layouts
You do not need to rewrite your custom reporting prompts every month. Once you create a visual layout that fits your client’s needs, you can save that custom view inside your Studio workspace. For your next monthly review, open the saved layout, select your new date window from the drop-down menu, and the platform will automatically populate the charts, data grids, and written recaps with fresh data.
White-Labeling and Export Options
When sharing reports with clients or executive boards, presentation quality matters. Metricool Studio allows you to export completed views as clean PDF documents or interactive PowerPoint presentations. For advanced account tiers, these exported files can be fully white-labeled, enabling you to add your agency logo, apply custom color schemes, and remove third-party branding.
You can also skip email attachments altogether by generating a secure, live URL link to share directly with clients. This responsive web view lets stakeholders review interactive charts on any device without requiring a platform login, keeping client communication clear and transparent.
Incorporating Competitor Benchmarking into Your Reports
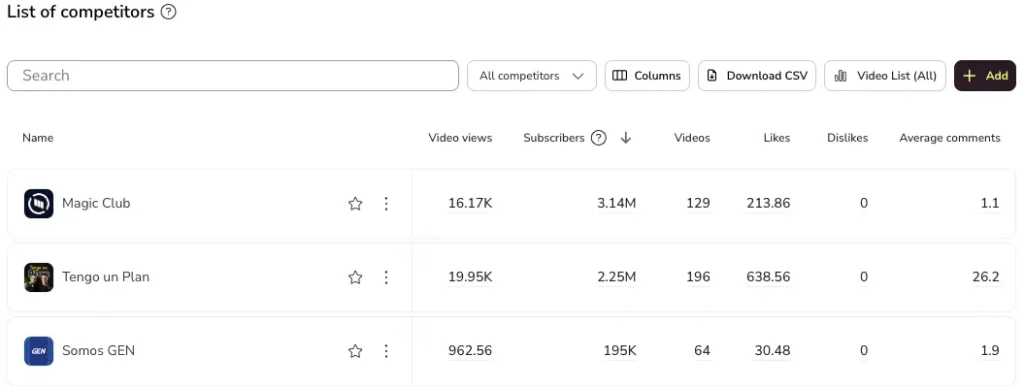
A key advantage of managing your video strategy inside a centralized platform is the ability to benchmark your channel against your direct niche competitors. Analyzing your performance in isolation makes it hard to tell whether a drop in monthly views is due to seasonal audience shifts or a decline in video quality.
Metricool allows you to track up to ten competitor YouTube channels directly within your analytics dashboard. By simply adding a competitor’s channel handle or URL, the platform pulls public performance data, including:
- Total subscriber counts and subscriber growth trends.
- Aggregate video view counts across recent upload cycles.
- Total published video volume.
- Average interaction metrics per video, including likes and comments.
Including these competitor benchmarks inside your custom reports adds valuable context for clients and brand leadership. It shows where your channel leads the niche, highlights content gaps in competing strategies, and proves your team’s market share growth over time.
For a complete walkthrough on generating AI-driven social media reports and customizing your performance views, watch the official video guide on Analyzing Social Media with Metricool Studio below. This video provides a step-by-step tutorial on using both Guided and Expert modes to build executive-ready summaries in minutes.
