YouTube Marketing Statistics: The 2026 Video Economy
 Kalum
20 February 2026
Kalum
20 February 2026 
While many predicted that shorter attention spans would kill long-form content, the reality in 2026 is far more interesting. YouTube remains the titan of the video world, acting as a search engine, an entertainment hub, and a primary revenue source for millions of creators. Understanding the latest YouTube stats is vital for anyone who wants to remain relevant on the platform.
To give you a clear outlook, we have analyzed the data from our 2026 Social Media Study, where we studied 7,327,083 videos from 82,074 accounts. The numbers tell a story of massive growth in reach, even as the way users interact with content becomes more complex. Here is the definitive breakdown of YouTube marketing stats that you need to know this year.
The Global Picture
When we compare the performance of channels from 2024 to 2025, we see a platform that is successfully balancing its legacy as a long-form destination with its newer identity as a short-form powerhouse. The following table highlights the key performance shifts across the board.
Performance Comparison: 2024 vs. 2025
| Metrics | 2024 | 2025 | Percentage Difference |
| Weekly Posts | 20.01 | 20.83 | +4% |
| Views | 389.90 | 687.21 | +76% |
| Interactions | 14.54 | 16.09 | +11% |
| Comments | 0.50 | 0.69 | +38% |
| Dislikes | 0.43 | 0.41 | -4% |
| Likes | 12.16 | 13.47 | +11% |
| Shares | 1.45 | 1.52 | +5% |
| Engagement | 3.73 | 2.34 | -37% |
Analyzing the 76% Surge in Views
The most staggering figure in the YouTube usage stats for 2026 is the 76% increase in views. In just one year, the average number of views per video has jumped from 389.90 to 687.21. This indicates that the platform’s distribution algorithm has become significantly more efficient at matching content with the right viewers.
Several factors contribute to this spike:
- The Shorts Effect: YouTube Shorts have moved beyond being a TikTok clone and are now a primary discovery engine. A single Short can rack up thousands of views in hours, which then feeds the data back to the main channel.
- Smart TV Integration: More people are watching YouTube on their living room televisions than ever before. This creates a more passive, lean-back viewing experience that leads to higher view counts.
- AI-Powered Recommendations: The recommendation engine in 2026 is scarily accurate. It knows what a user wants to watch before the user does, keeping people on the site for longer sessions.
However, while views are up by 76%, the frequency of posting has only increased by 4%. This is a crucial takeaway for creators: you do not necessarily need to post more content to get more views. Instead, the focus should be on the quality and the metadata of the content you already produce.
2026 YouTube Engagement Stats
When analyzing 2026 YouTube engagement stats, our study found a glaring contradiction. While views, likes, and comments are all up, the overall engagement rate has dropped by 37%. In 2024, the engagement rate stood at 3.73, but in 2025, it fell to 2.34.
Because views have grown so rapidly (76%), interactions would have to grow at an equally explosive rate to keep the engagement percentage steady. However, interactions only grew by 11%. For a marketer, this means you should not panic if your engagement rate looks lower than it did two years ago. If your total number of likes and comments is increasing, your channel is growing. The lower percentage is simply a byproduct of your content reaching a much wider, more passive audience.
Comments or Comets?
One of the most positive YouTube marketing stats from our study is the skyrocketing of comments, which increased by 38% in 2026. While likes grew by 11%, comments jumped from an average of 0.50 to 0.69 per video.
This suggests that YouTube is becoming more of a community-driven platform. Users are no longer just watching passively.
- Comment-to-Shorts Features: YouTube has made it easier for creators to reply to comments with a video, which encourages more people to speak up in hopes of getting a personalized response.
- Niche Communities: As the platform matures, users are finding “their people” in the comments sections of specific niches, from mechanical keyboard enthusiasts to sustainable fashion advocates.
For brands, this is a clear signal to invest in community management. If you are not replying to your comments, you are ignoring a part of the platform that is growing nearly four times faster than the “Like” button.
The Quiet Death of the Dislike
A minor but telling statistic is the 4% decrease in dislikes. In 2026, the culture of “dislike bombing” has largely faded. This is partly due to YouTube’s decision years ago to hide public dislike counts, which removed the social incentive for mass negativity.
However, it also reflects a more curated user experience. Because the algorithm is so good at showing people content they actually like, fewer people are encountering videos that they find offensive or irrelevant enough to click the dislike button. For creators, this means a more supportive environment where constructive criticism happens in the comments rather than through a negative metric.
How to Check YouTube Stats: A Professional Guide
If you want to stay competitive, you need to know how to monitor your own performance. Understanding how to check YouTube stats is the first step toward a data-driven strategy.
Using YouTube Studio
The native YouTube Studio app remains the most immediate way to see your numbers. You should pay close attention to:
- Real-time Views: To see the immediate impact of a new upload.
- Audience Retention: The exact moment people stop watching your video. If you see a steep drop at the 30-second mark, your intro is too long.
- Traffic Sources: Knowing whether your views come from “Search” or “Suggested Videos” tells you if your SEO is working.
Going Beyond the Native App
While YouTube Studio is great for a quick check, it can be difficult to see the “big picture” when you are managing multiple channels or platforms. This is where external analytics tools become necessary. You need to see how your YouTube growth compares to your Instagram or TikTok performance to understand your overall brand health…
Compare YouTube Stats vs Other Platforms with Metricool
This is where Metricool changes the way you work. Instead of manually exporting data from YouTube Studio into a spreadsheet, Metricool brings all your YouTube stats into one clear, visual dashboard. You can track your interactions and shares alongside your views, giving you a holistic look at your community’s health and enabling you to easily compare YouTube stats with your accounts on all other platforms.
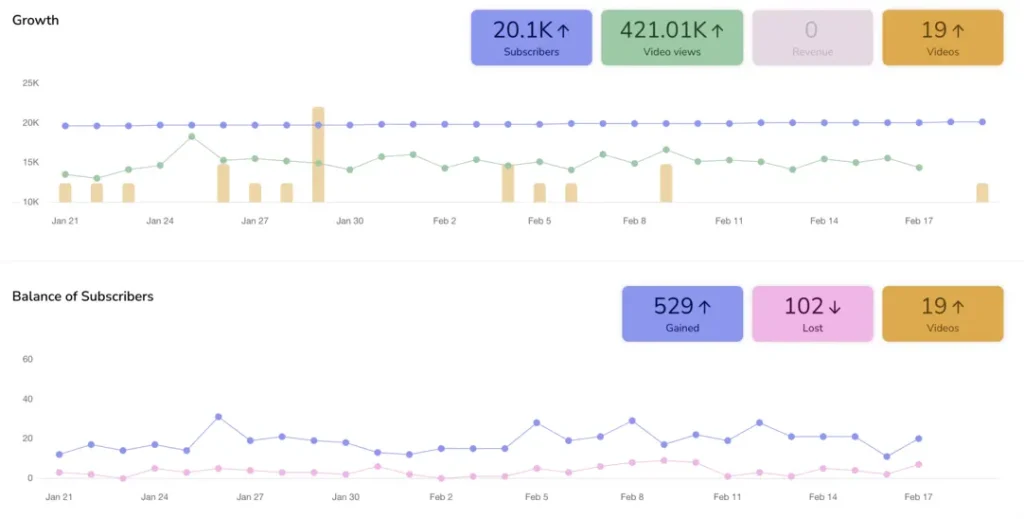
You can see your best hours to post, and more importantly, Metricool’s reporting feature allows you to generate professional documents for clients or stakeholders in seconds. All your data and scheduling tools in one place, sounds great, right?
4 Practical Applications for Marketers in 2026
How do you take these YouTube marketing stats and turn them into a plan?
1. Optimize for the “Pass-Through” Share
With shares up by 5%, your content needs to be relatable. People share videos that make them look smart, funny, or informed. When you are scripting your next video, ask yourself: “What is the one 10-second clip in this video that someone would want to send to their group chat?”
2. The “First Comment” Strategy
Since comments are growing at 38%, you should always be the first person to comment on your own video. Pin a question to the top of the thread to spark a debate or ask for an opinion. This “primes the pump” for the audience and encourages that high-value interaction that the algorithm loves.
3. Consistency Over Intensity
The 4% increase in weekly posts shows that the top creators are not burning out by posting five times a day. They have found a rhythm that works. Consistency is more important than frequency. A channel that posts one high-quality video every Tuesday will almost always outperform a channel that posts sporadically five times a week.
4. Search-Focused Titles and Descriptions
As YouTube becomes a more dominant search engine, your SEO strategy must be airtight. Use your description box to provide a detailed summary of the video, including keywords that your target audience is likely to type into the search bar. This is a primary driver of the “Views” growth we are seeing in the 2026 data.
