

How to Generate Custom Twitch Reports with Metricool
 Carlos Bravo
10 July 2026
Carlos Bravo
10 July 2026 
Managing a live streaming channel requires balancing real-time entertainment with backend statistical analysis. For content creators and marketing teams, streaming live on Twitch generates an enormous volume of real-time data, from shifting subscription numbers to chat interactions and sudden viewer spikes. However, collecting all these separate metrics into a clear summary often turns into an exhausting post-stream chore. Spending your Friday afternoons jumping between different creator dashboards, capturing manual screenshots, and trying to paste raw figures into slide decks takes away critical time that should be spent refining your upcoming content plan.
To build a sustainable streaming business or successfully showcase channel performance to external partners, you need a systematic way to produce comprehensive custom Twitch reports. Raw numbers on their own rarely show the full picture. A sudden increase in viewer hours means very little unless you can connect it directly to a specific broadcast topic, a promotional social post, or a particular streaming window. This is where customized, automated reporting steps in to eliminate manual spreadsheet work, allowing you to focus your attention on community building and content execution.
Twitch Analytics Challenges
Live broadcasting produces a completely different set of performance indicators compared to traditional, static social media networks. On standard social platforms, engagement is measured after publication using clear metrics like likes, shares, or comments left on a permanent post. On Twitch, engagement happens live, minute by minute, and fluctuates wildly depending on game choices, chat interaction levels, raid events, and stream schedules.
When marketing groups or individual creators try to build their own summaries, they typically face three distinct operational friction points:
- Fragmented Data Control Centers: Twitch provides excellent native creator dashboards, but that information lives in complete isolation from the rest of your brand presence. If a marketing campaign involves a live stream supported by promotional updates on Instagram and TikTok, compiling a complete campaign recap forces you to gather numbers from three or four separate browser windows.
- Lack of Practical Context: Standard analytical panels show you that your viewer counts dropped on a specific Tuesday, but they fail to explain the underlying cause. Without text summaries and comparison overlays, you are left to guess whether the drop was caused by a shorter broadcast duration, an unfamiliar game category, or your start time changing.
- Time-Intensive Presentation Layouts: Building professional updates for corporate sponsors or internal brand reviews usually requires extracting CSV files, formatting tables in a separate spreadsheet app, and designing visual charts. By the time the final report is ready to send, the data is often old, and your team has wasted hours on basic manual entry.
What is Metricool Studio?
Metricool Studio is an AI-powered reporting engine built directly into the Metricool platform, designed to transform complex social media and streaming data into clear, ready-to-share Analytics Views. Powered by advanced language models, this specialized workspace removes the technical hurdles of traditional data management by allowing you to interact with your cross-platform metrics using natural language.
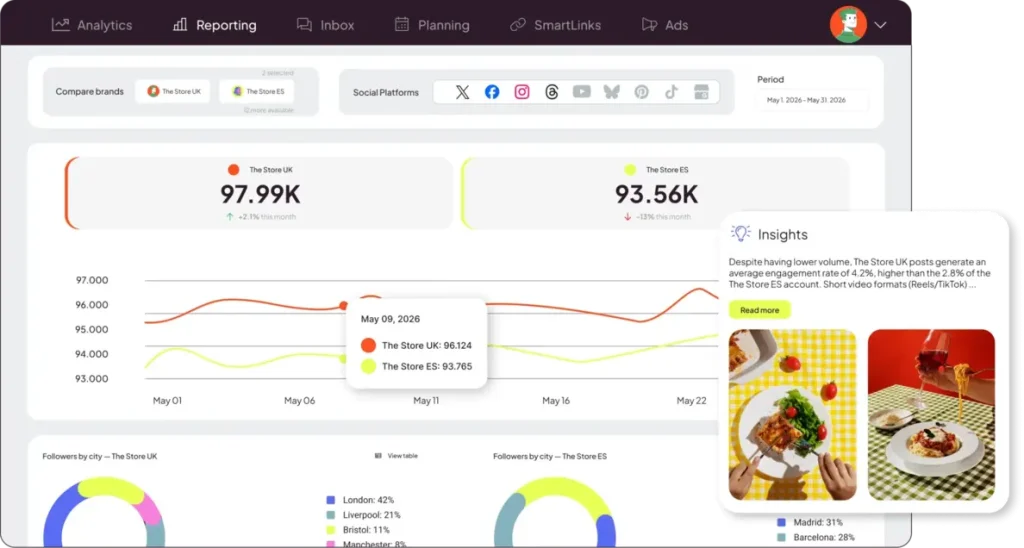
Rather than building static report charts by hand or relying on rigid templates that fail to capture your unique milestones, you can now use an AI-powered analytics engine to generate comprehensive custom Twitch reports using plain language prompts.
How to Connect Your Twitch Account to Metricool
Before you can start generating automated custom Twitch reports, you must link your broadcasting channel to your Metricool workspace. The platform organizes your marketing assets using a clean “Brand” structure, where a single brand bundle holds one profile for every supported digital network.
Follow these direct steps to link your channel and start your data collection:
- Open Your Settings Panel: Log into your primary Metricool control panel, navigate to the top right drop-down menu, and select your target Brand.
- Locate the Twitch Tab: Click on the “Connections” tab in the left-hand navigation menu. Scroll down through the listed social options until you find the Twitch icon, then click “Connect.”
- Authorize the Official API Connection: The application will safely redirect you to the official Twitch login gateway. Enter your streaming credentials and click “Authorize” to grant secure permissions. This official connection allows Metricool to collect your channel analytics safely without ever seeing or storing your private account password.
- Verify the Connection State: Once authorized, the browser will return you to your main dashboard, where a green checkmark will confirm that your profile is active.
As soon as this connection goes live, the platform automatically retrieves your previous 30 days of channel activity. From that exact moment forward, your data is stored continuously in your permanent history file, providing an uninterrupted ledger for your long-term Twitch reports.
How to Generate Custom Twitch Reports using Metricool Studio
With your channel connected and recording data, you can build your first personalized tracking view. Metricool Studio allows you to avoid standard cookie-cutter templates and create a report that directly mirrors your current business milestones.
Step 1: Access the Reporting Hub
Navigate to the top main horizontal menu on your dashboard and click on “Reporting.” In the secondary left-hand sidebar menu, click directly on “Metricool Studio” to open the AI-driven prompt workspace.
Step 2: Choose Your Creation Method
Decide whether you want to use the structured drop-down menus of Guided Mode or dive straight into Expert Mode. If you are tracking standard monthly viewer performance, Guided Mode is highly efficient. If you need to build a highly nuanced campaign summary for a specific corporate sponsor, select Expert Mode.
Step 3: Write a Precise Report Prompt
The quality of your generated view depends directly on the clarity of your text prompt. To build useful custom Twitch reports, avoid vague instructions like “show me my Twitch data.” Instead, use specific context, date ranges, and performance goals.
Consider these realistic prompt examples for your channel reviews:
“Analyze my Twitch channel’s performance over the last 60 days. Focus on subscriber growth trends, total broadcast hours, and peak concurrent viewer numbers. Include a written summary explaining which days of the week delivered our highest audience engagement levels.”
“Compare our Twitch stream metrics from this quarter against the previous quarter. Generate a clear comparison table showing follower acquisition, average chat interaction volume, and overall clip views, then provide three actionable recommendations for our next streaming schedule.”
Step 4: Review and Save Your View
Click the “Generate View” button. The AI processing engine runs in the background, allowing you to continue managing your calendar or close the tab entirely. A notification bell in your top menu will highlight when your view is fully populated.
When you open the finished view, you will find a beautifully organized page featuring custom charts, clean data tables, and an AI-generated text summary. This text does not just repeat the numbers; it explains the exact patterns behind your stream changes, highlighting which individual broadcasts drove your community milestones.
Critical Twitch Metrics to Feature in Your Custom Reports
To ensure your Twitch reports deliver real commercial value to your clients or corporate sponsors, you need to look beyond vanity metrics and highlight figures that demonstrate true audience loyalty and brand impact. Metricool Studio can track, organize, and interpret several core areas of your live stream data:
| Twitch Performance Area | Specific Metric Tracked | Marketing and Operational Value |
| Stream Performance | Total Hours Broadcasted | Tracks consistency and evaluates the direct time investment made by your production team. |
| Audience Reach | Peak Concurrent Viewers (CCV) | Measures your maximum live room size, indicating your channel’s ultimate promotional power during major broadcast events. |
| Audience Loyalty | Average Concurrent Viewers | Shows your baseline room stability, reflecting your true core community size across typical streaming days. |
| Community Engagement | Chat Message Velocity | Highlights how actively your viewers are interacting with your content, which is a major metric for brand integrations. |
| Channel Discovery | Follower Acquisition Rate | Tracks how many new accounts are discovering your stream, proving your long-term audience acquisition potential. |
| Short-Form Impact | Generated Clip Performance | Measures how well your highlights travel across external video networks to drive viewers back to your live channel. |
Setting Up a Long-Term Live Streaming Data Loop
Transitioning to an automated, prompt-driven data system does more than just save your marketing team time on Friday afternoons. It establishes a reliable operational loop where every single broadcast directly informs your upcoming content choices.
To get the absolute most out of your reporting setup, establish a clear weekly routine:
- Run a Weekly Post-Stream Audit: Every Monday morning, prompt the analytics engine to review your streaming hours against your chat message velocity from the previous week. Identify the exact moments where audience engagement spiked.
- Correlate Social Performance: Cross-reference your stream spikes against your social posts. Determine if an announcement on Instagram or a highlight clip on TikTok directly drove a larger audience to your live broadcast room.
- Refine Your Streaming Timetable: Use the data to adjust your broadcast hours, game selection categories, and community engagement tactics based on clear historical trends rather than generic industry assumptions.
