Social Media Research Study 2022: Instagram
 Isabel Romero
12 September 2022
Isabel Romero
12 September 2022 
How professionals, content creators, and brand accounts use Instagram.
Study based on 185,671 professional Instagram accounts, 1,856,089 feed posts, 6,761,264 stories and 279,479 reels.

Metricool’s annual Instagram 2022 study is here. The meeting point for marketers, social media managers, and agencies that manage professional Instagram accounts. Data is compared with our previous year’s Instagram study to see how this social media platform has evolved, learn about the current strategies and content formats that work best, and make better decisions based on real data.
How to use the 2022 Instagram Study
This analysis combines all the analyzed accounts, without distinction by niche, to find general Instagram trends.
In addition to relying on this data, it is always advisable to analyze your own competitors or the accounts you want to resemble so you can draw specific conclusions for your Instagram strategy.
Instagram Trends 2022 and the big questions the study solves.
Has Instagram’s reach declined in the last year?

There is no universal answer.
If your strategy is mainly focused on feed posts and stories, your reach might have dropped by 20% to 25%. However, if you have introduced reels in your strategy, you should have noticed that your reach has increased significantly.
The average reduction in reach in stories has been 7.49%, and for feed posts, 22.35%.
Reels get between two to twelve times more reach compared to feed posts.
Which content format works best?
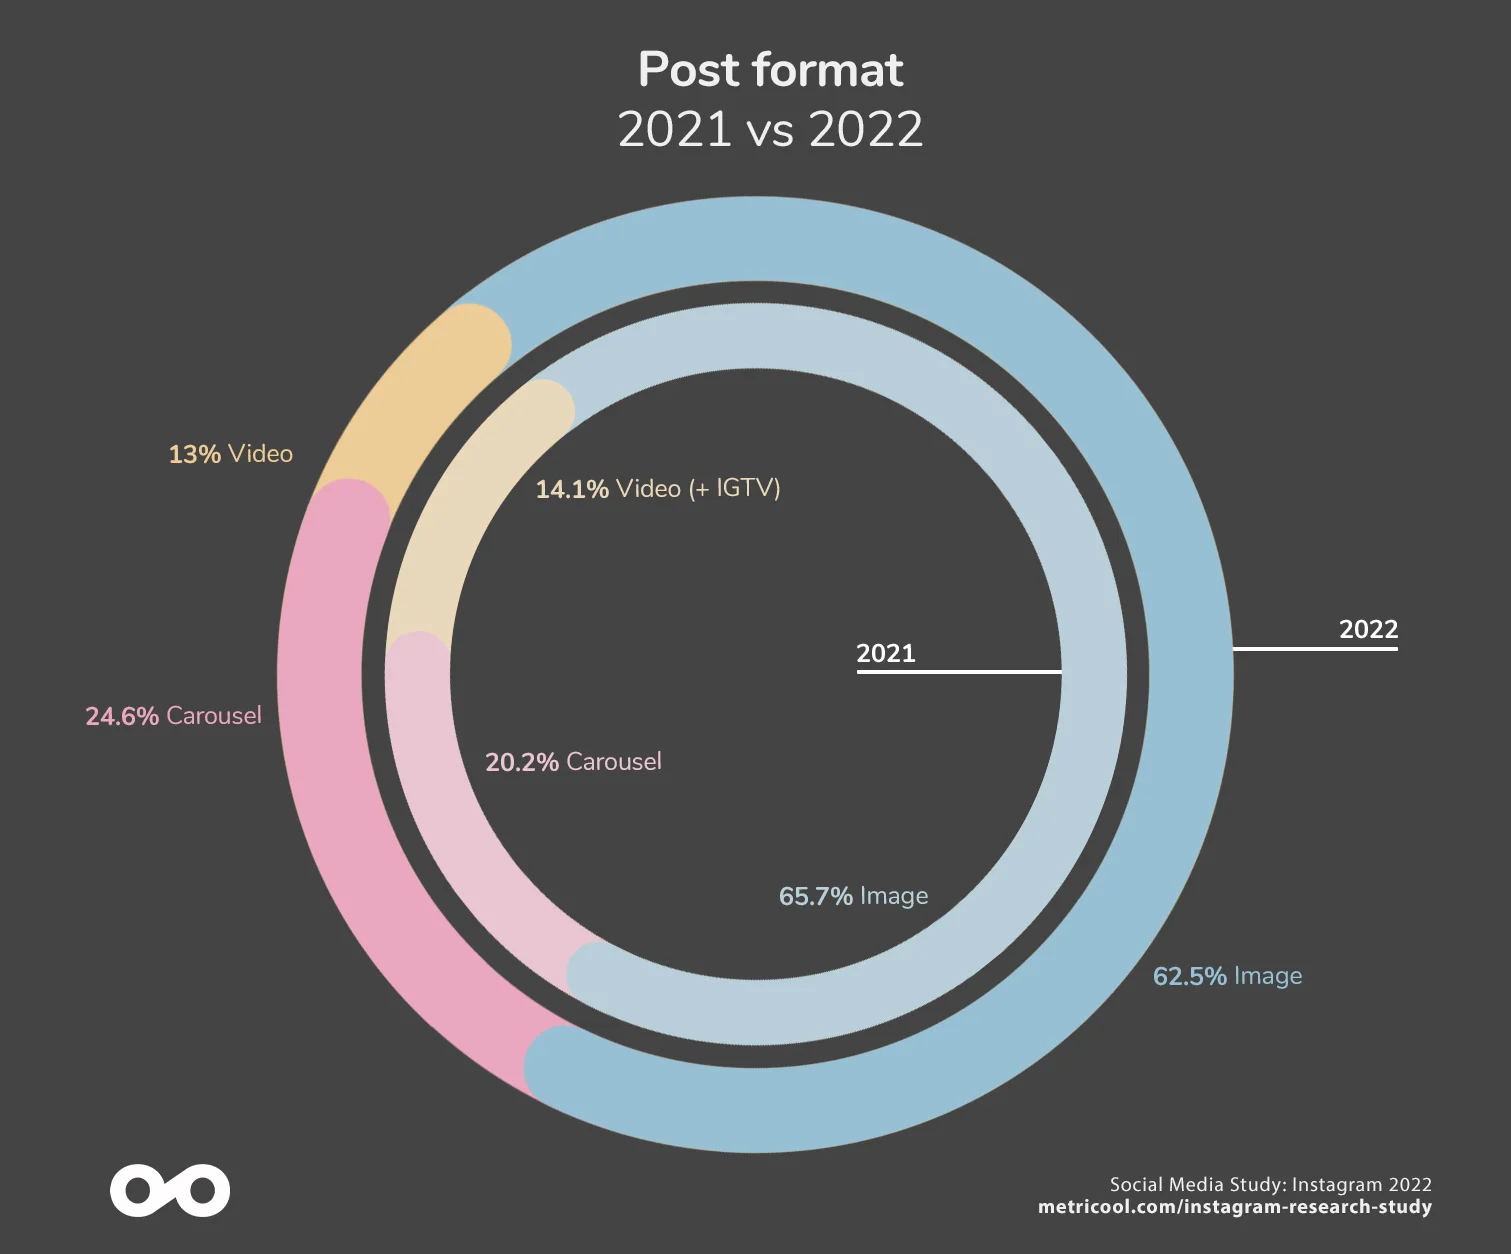
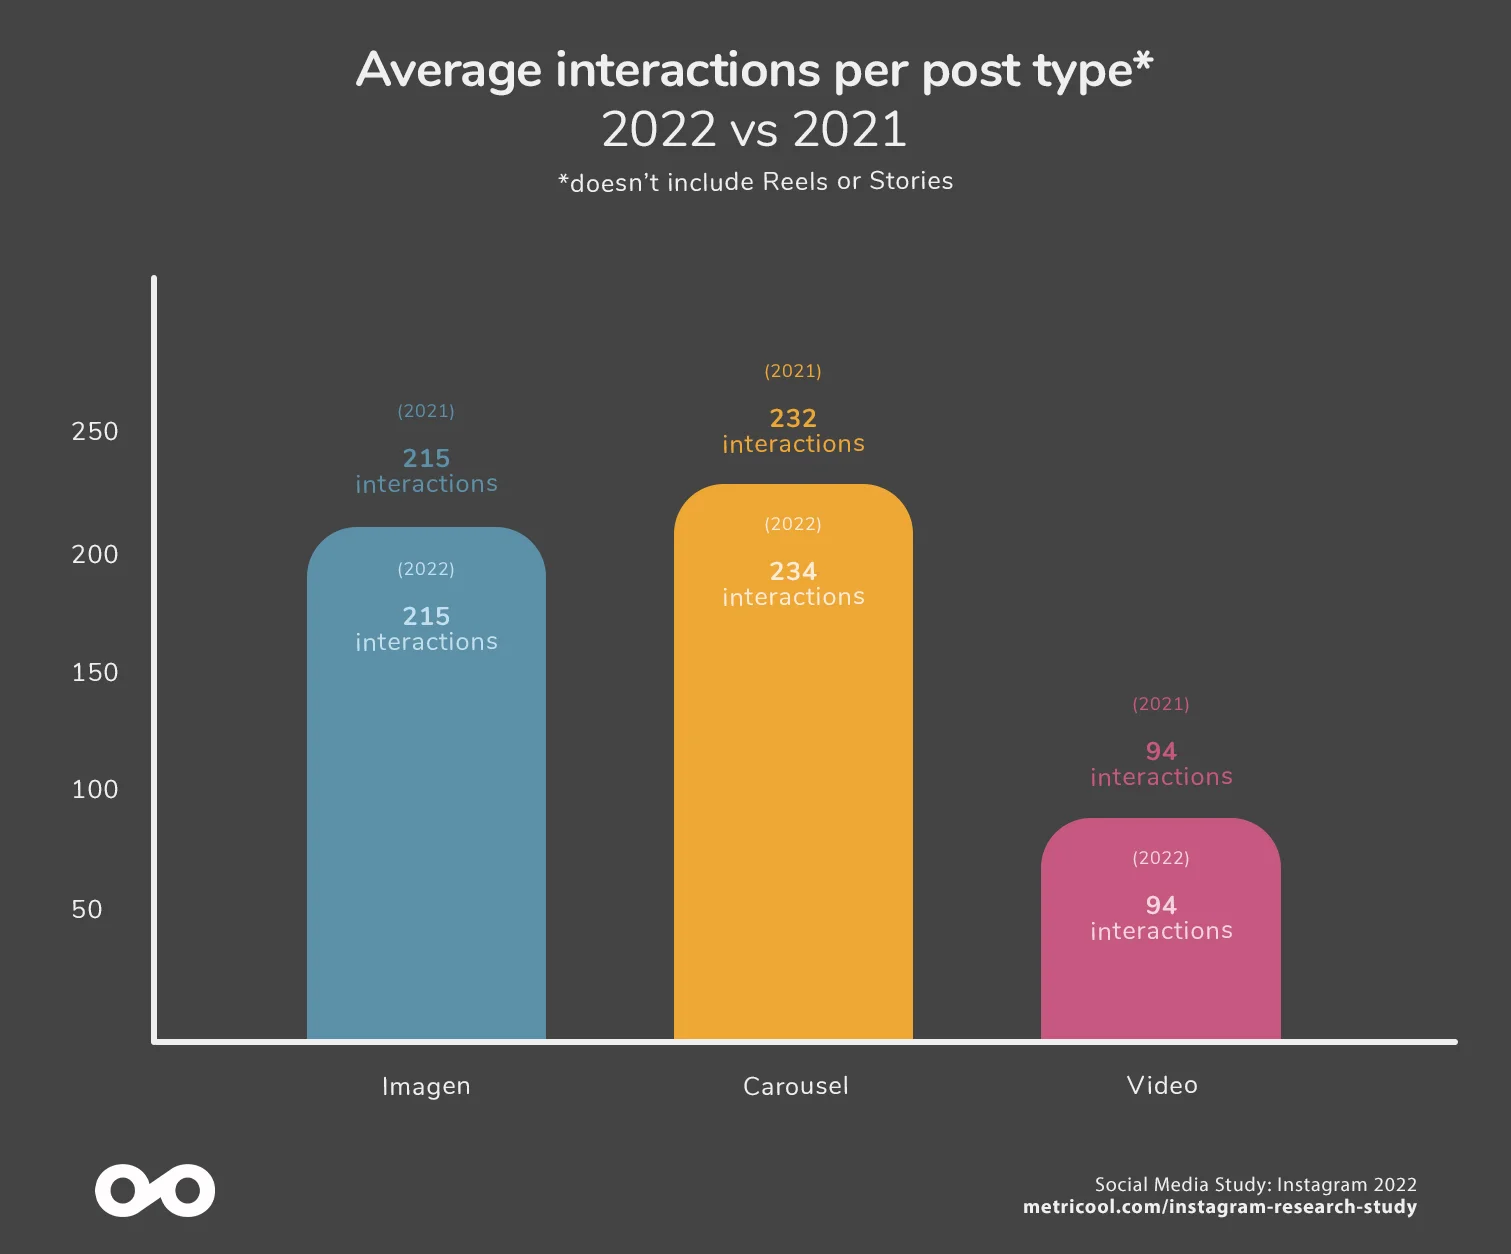
After reels, the next leading content type is carousels, which outperform single-image and video posts in terms of interactions and reach.
In the 2021 study, carousels had not yet surpassed single-image content. However, this year the data speaks for itself: in 2022, carousels have achieved 25.71% more reach than single-image posts.
Which posts help you grow the most on Instagram: stories, single-image posts, carousels, or reels?
The format with the most significant reach and interactions is reels.
In the second place, far behind reels, are the carousels. The third position is for single-image posts, followed by the video. Finally, in the last place, we find stories.
Even so, it all depends on the strategy you want to apply since each content type responds to different objectives:
- Reels- They help grow your account faster and reach people who don’t know your brand yet.
- Carousels– They increase interactions with your community.
- Stories– Despite being the type of content with a lower reach, stories are essential to keep the flame burning with your followers and build a loyal community.
- Single-Image or video in the feed– The same way that carousels encourage more interactions with your community. The choice between a carousel, single-image, or a video post will be determined by the type of message you want to send.

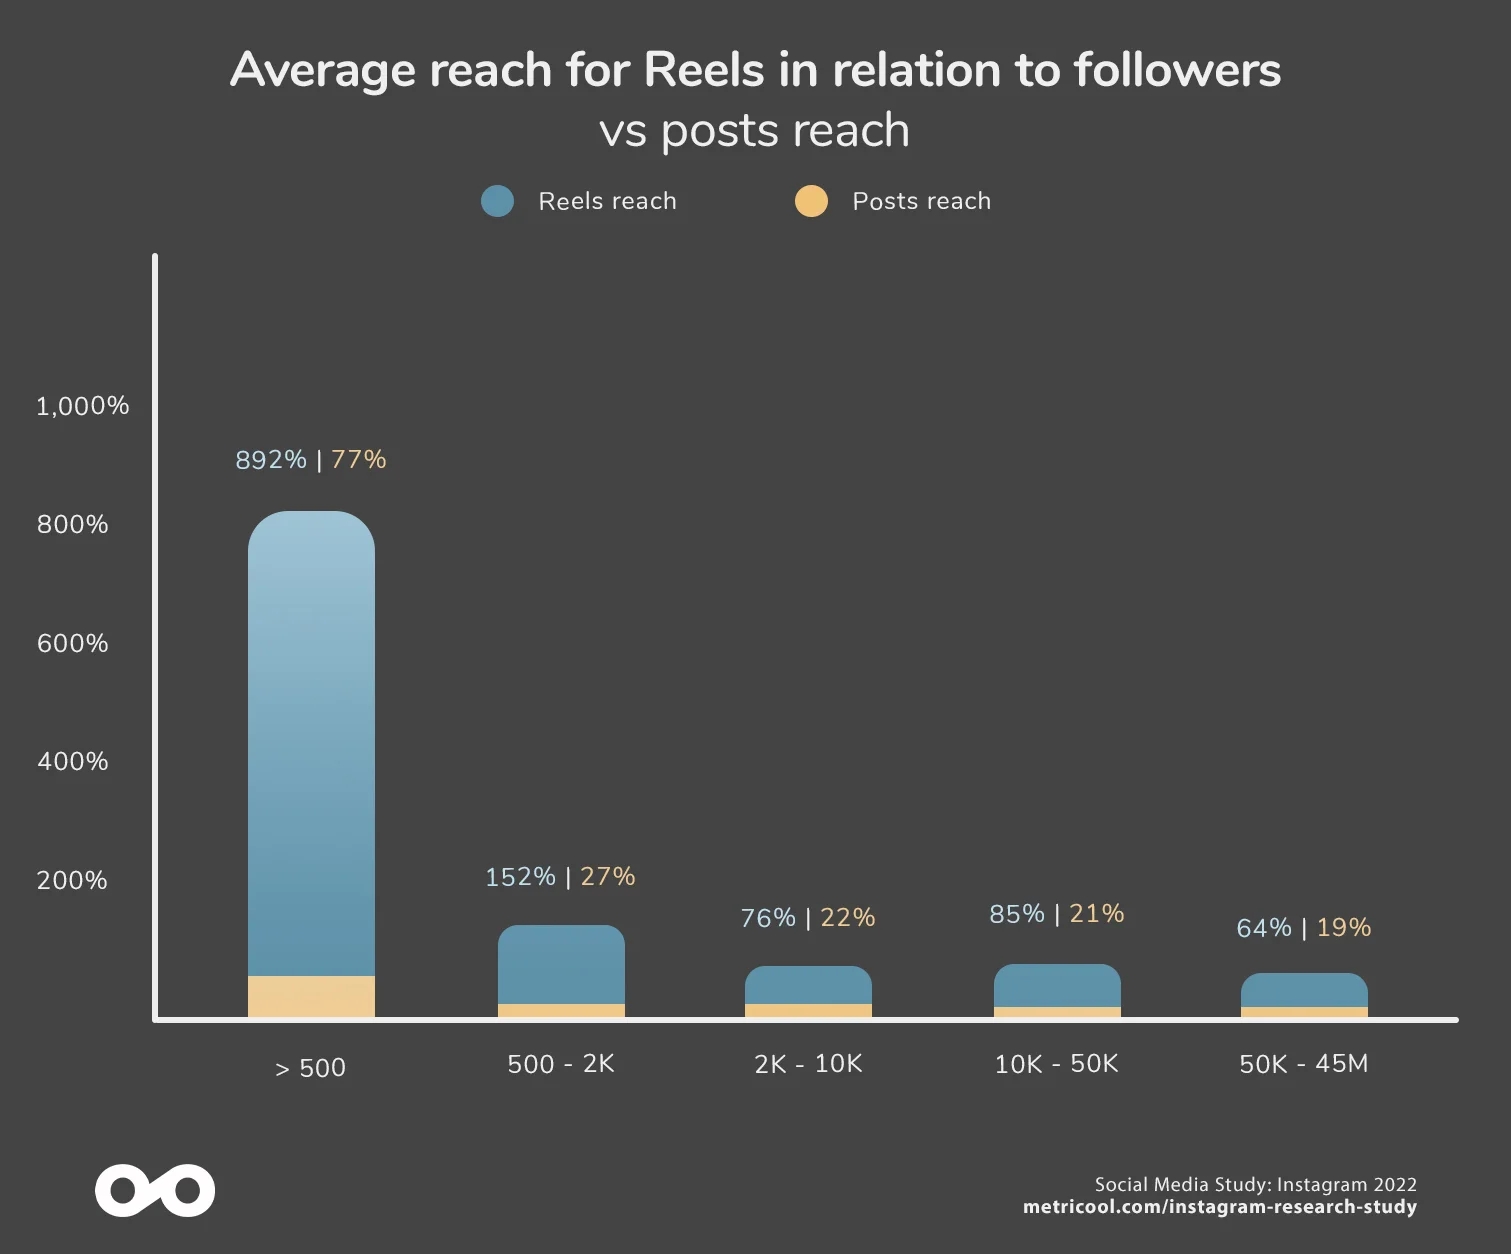
Are Reels here to stay?
Reels have become the leading content on Instagram, both in terms of reach and interactions.
The reach of reels is between 2 to 12 times greater compared to feed posts.
*For example, for accounts with up to 500 followers, the reach of reels is 1,218 times higher than posts in the feed.
Does the posting frequency influence the number of followers?
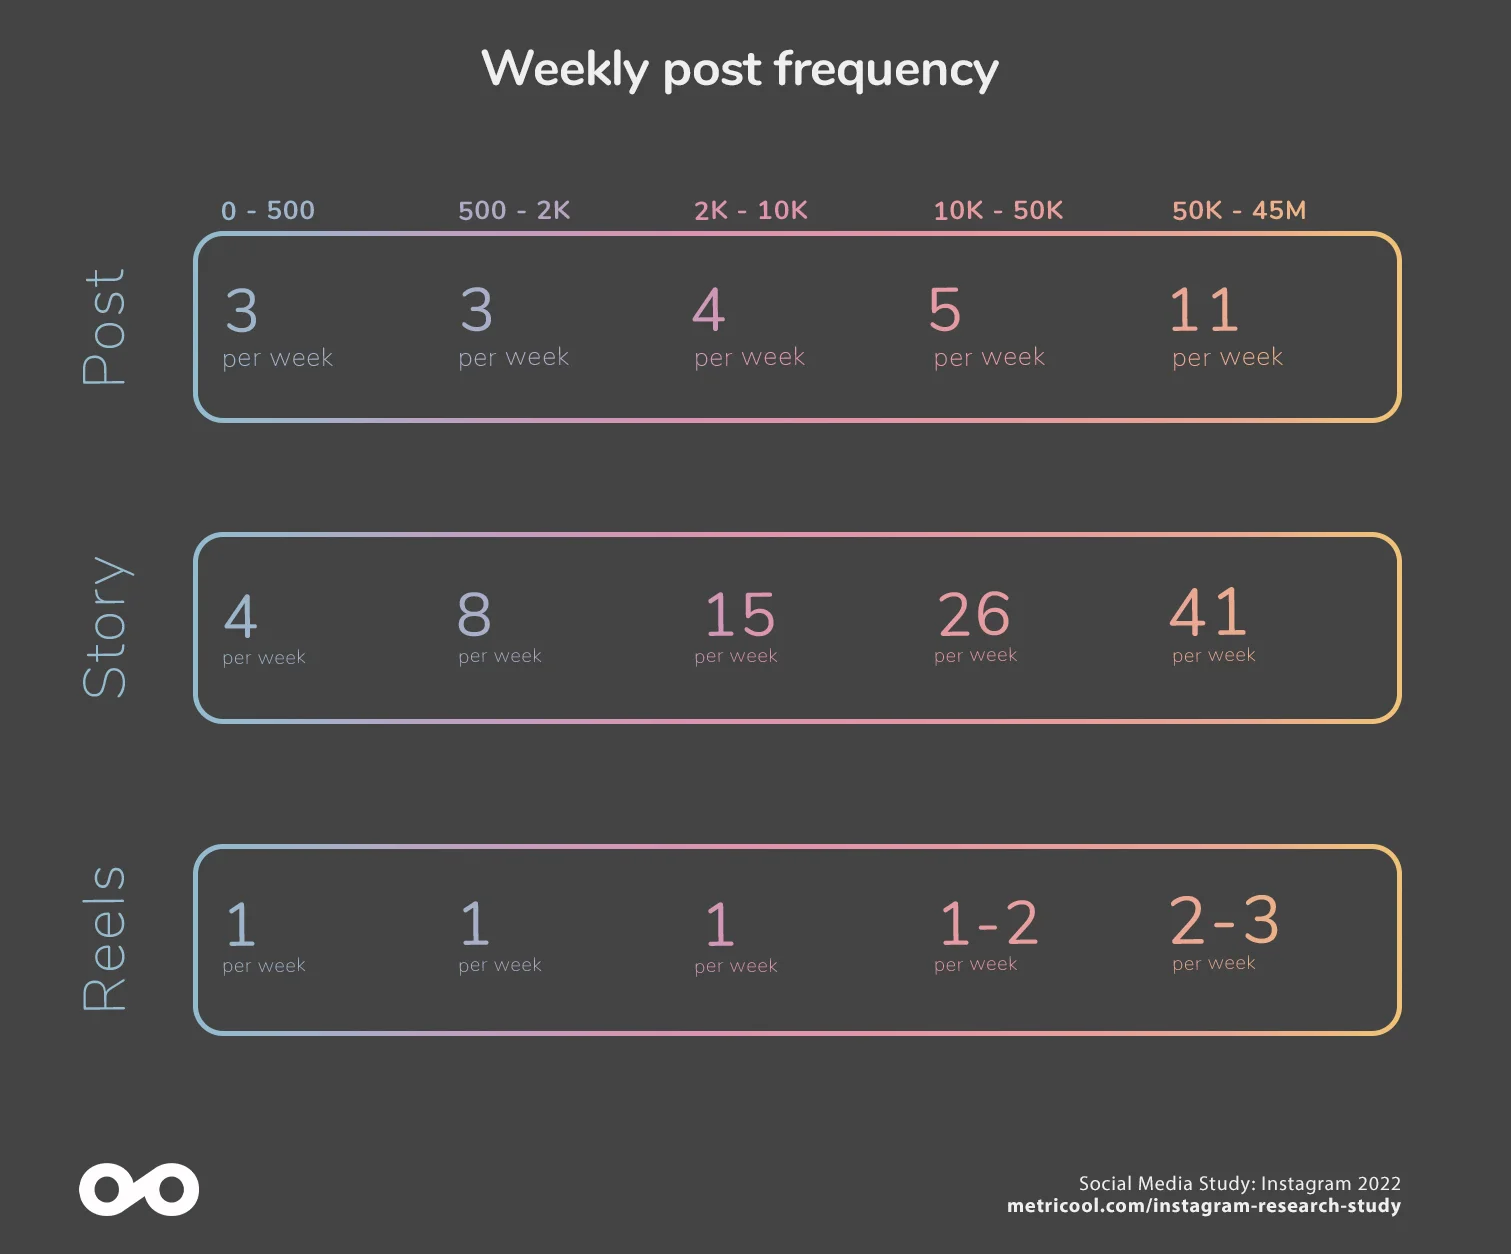
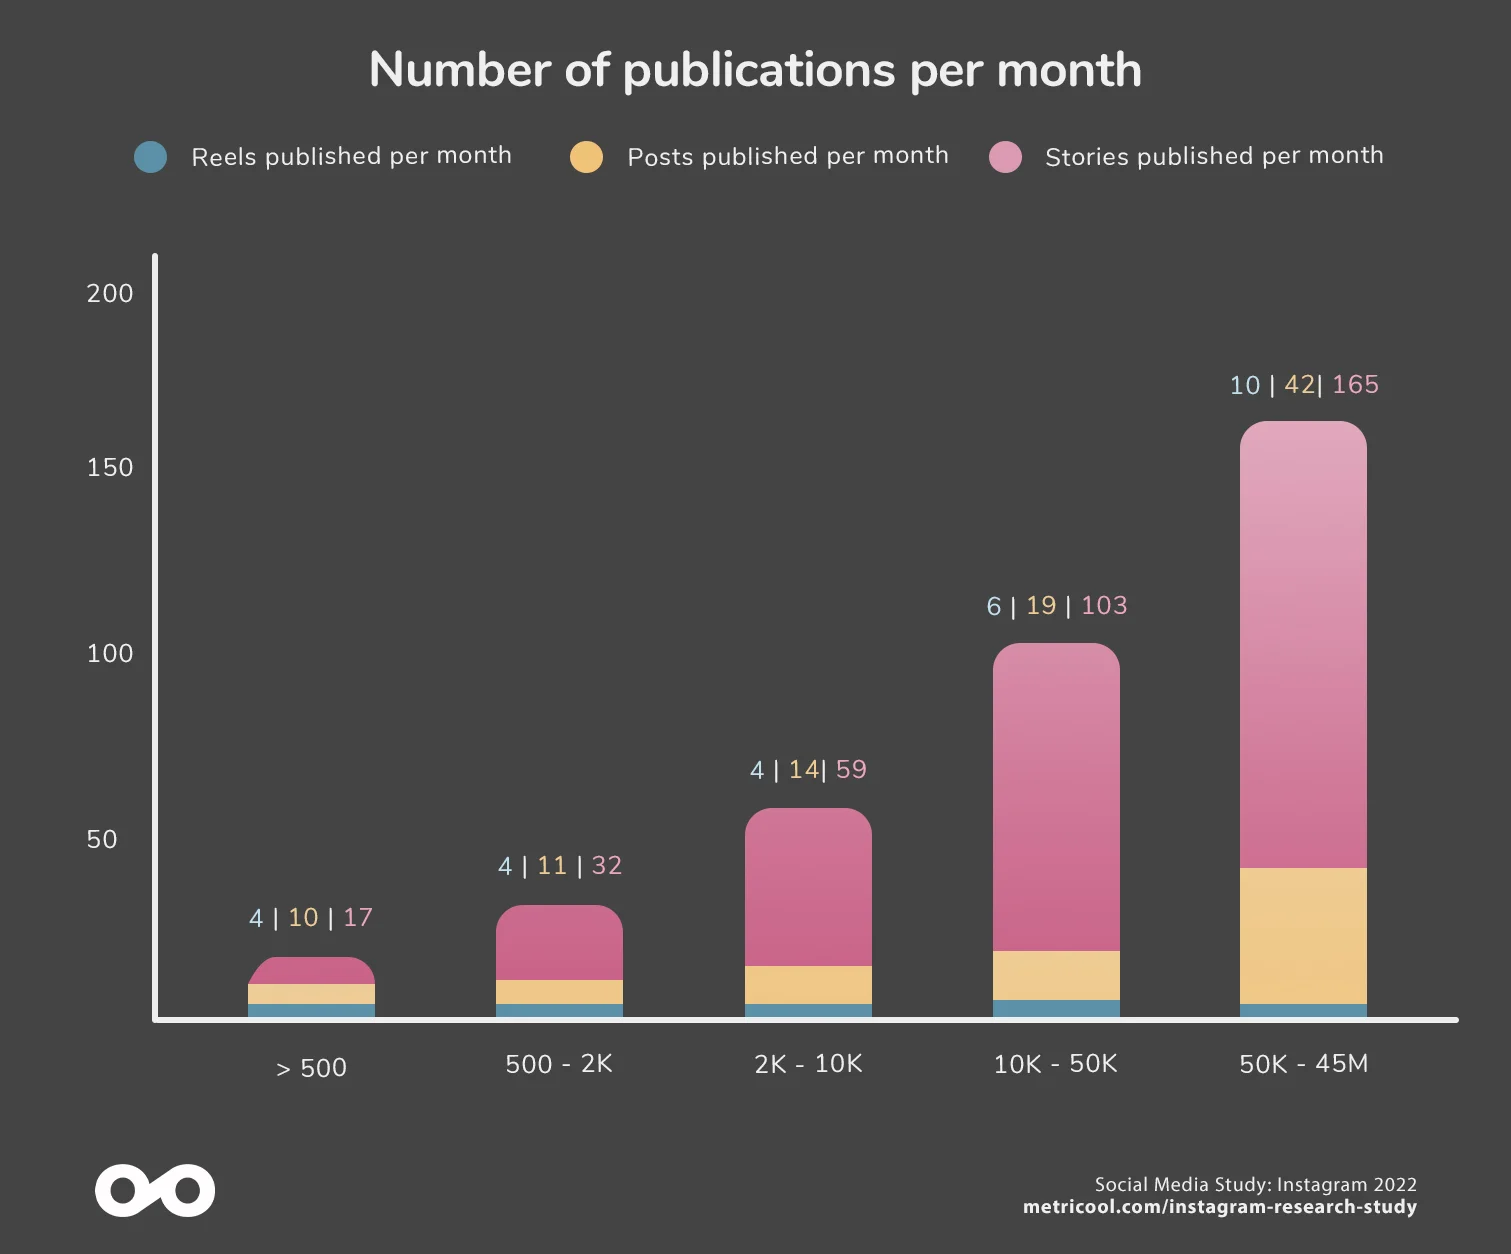
A clear trend was observed in 2021, and this trend remains in this study. Accounts with more followers have a higher posting frequency than smaller accounts. The same trend applies to stories, reels, and posts in the feed.
The greater the number of posts published, the greater the number of followers.

What’s the best time to post on Instagram?
The best time to post on Instagram has not changed if we look at our previous study in 2021. The winner is 8 PM, regardless of the day.
Welcome to Metricool’s annual Instagram study. We see in detail the results report.
The sample: what data was analyzed for this 2022 Instagram study?
The sample has collated information from 185,671 professional Instagram accounts: Both business and content creators. We have analyzed 1,856,089 feed posts, 6,761,264 stories and this is new, 279,479 reels.
Data collection was carried out for 30 days: June 2022. The same period was analyzed in the 2021 study.
*(For the 2022 Instagram study, we have expanded the sample of accounts analyzed by 33%, and, in addition to the content types analyzed last year, we have incorporated data from Reels, which was not available in 2021.).
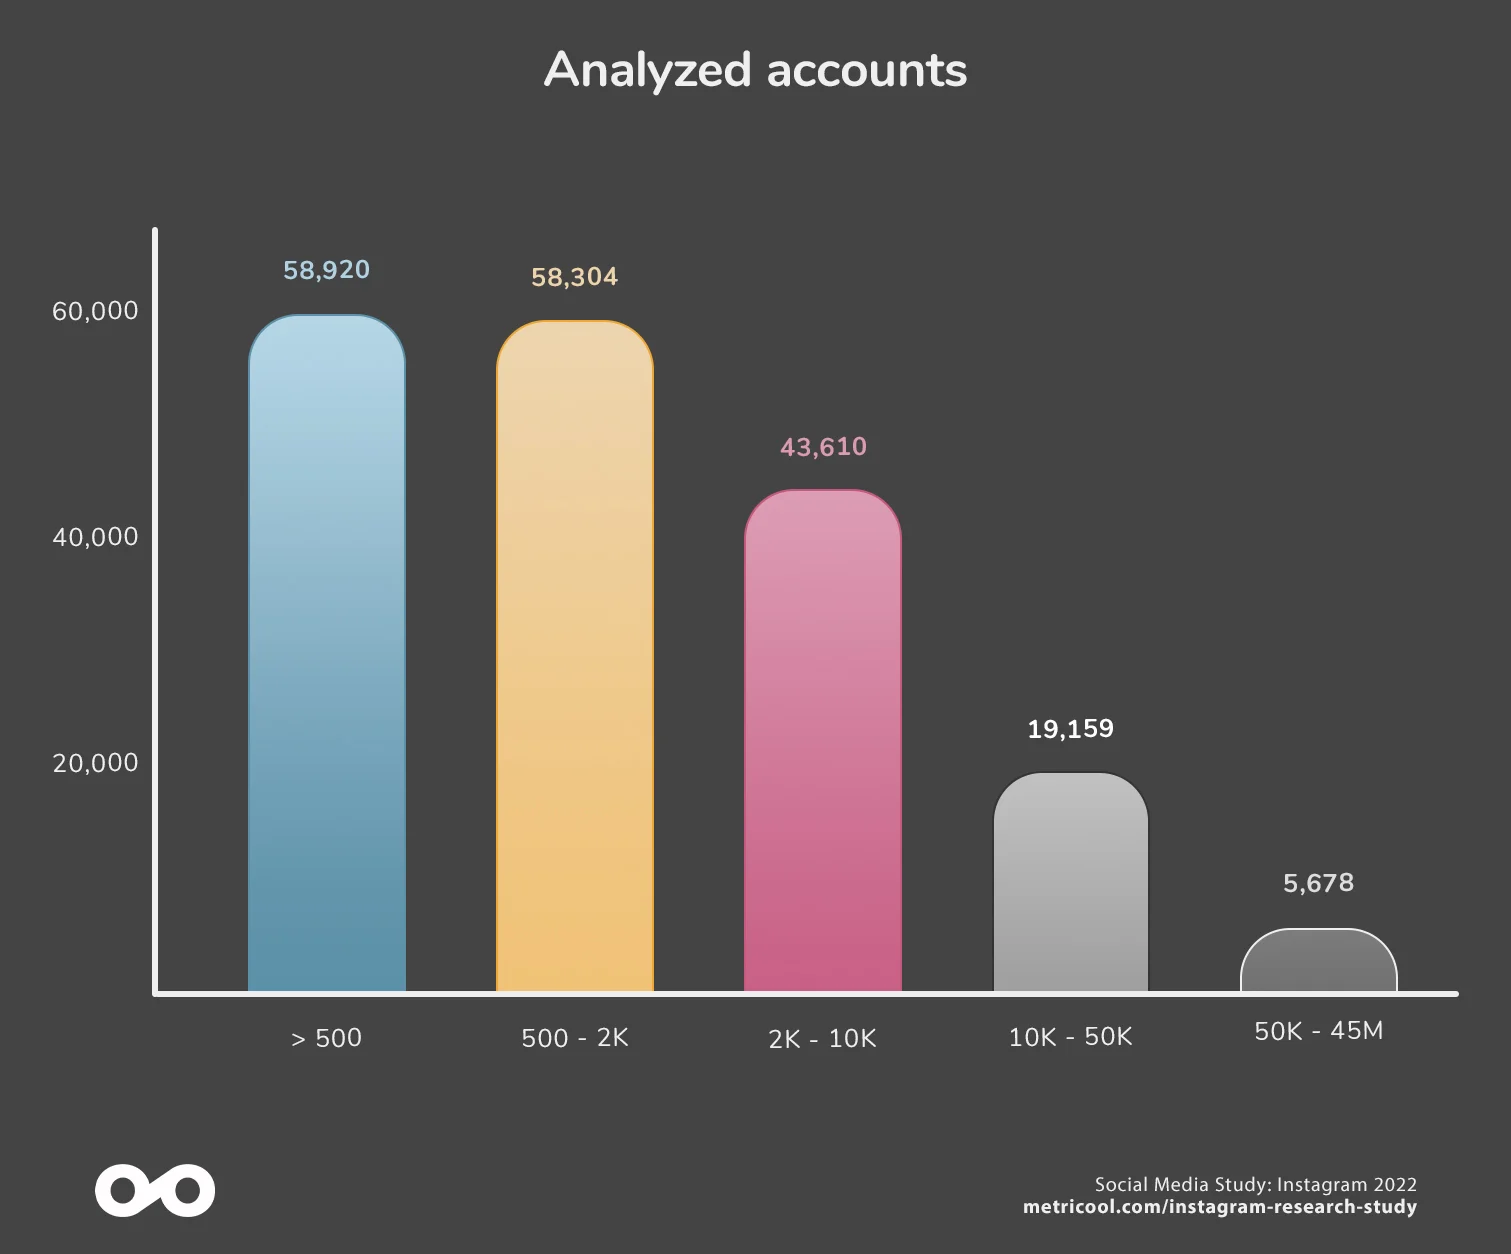
The analyzed Instagram accounts have been classified based on the number of followers. The objective is to analyze the results with comparable accounts and see how the data evolves as the accounts grow in number of followers.
As a result, there are five different groups based on the size of their audience:
- 0-500 followers
- 500- 2K followers
- 2K- 10K followers
- 10K-50K followers
- 50K-45M followers
Small accounts vs. Large accounts
In the study, we talk about small and large accounts. When we refer to small accounts, we speak of any group smaller than the next and vice versa. A small account does not have to be a group of 0-500 followers, but it would also be a group of 10K to 50K if you compare it with the next one from 50K to 45M.
Posting frequency based on accounts and type of content
Professional Instagram accounts of all sizes publish more stories than posts in the Feed.
The percentage of stories published per post varies depending on the size of the account since we observe that the larger the account, the more posts, and stories.
While it is true that reels are the most far-reaching format, we do not observe that the posting frequency increases significantly in larger accounts.
Types of content
On average, for every 10 posts published, 6.3 are single-image posts, 2.5 are carousels, and 1.3 are video posts. Compared to last year, single-image and video posts have been reduced, and now more carousels are shared on Instagram.
71% of posts in small accounts are single images, while in large accounts, they are reduced to 53%. Large accounts tend to post more videos.
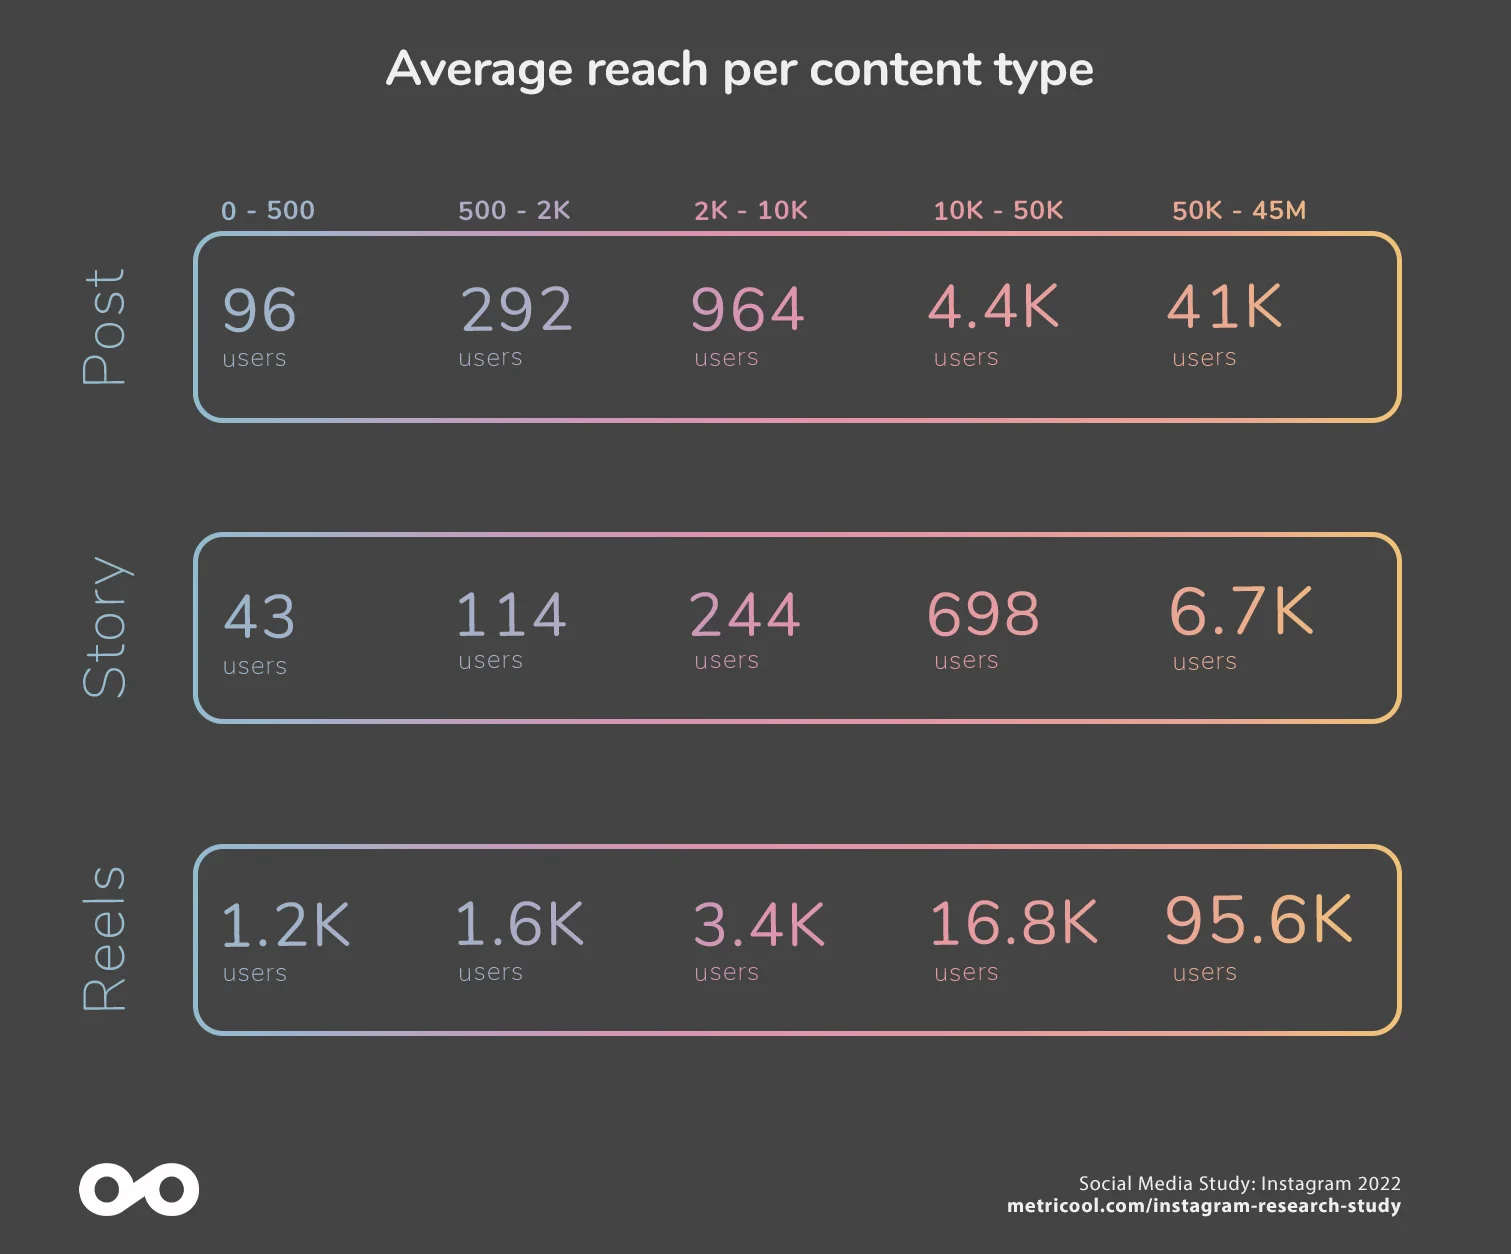
Reach by type of account and content.
What type of content has the highest reach on Instagram?
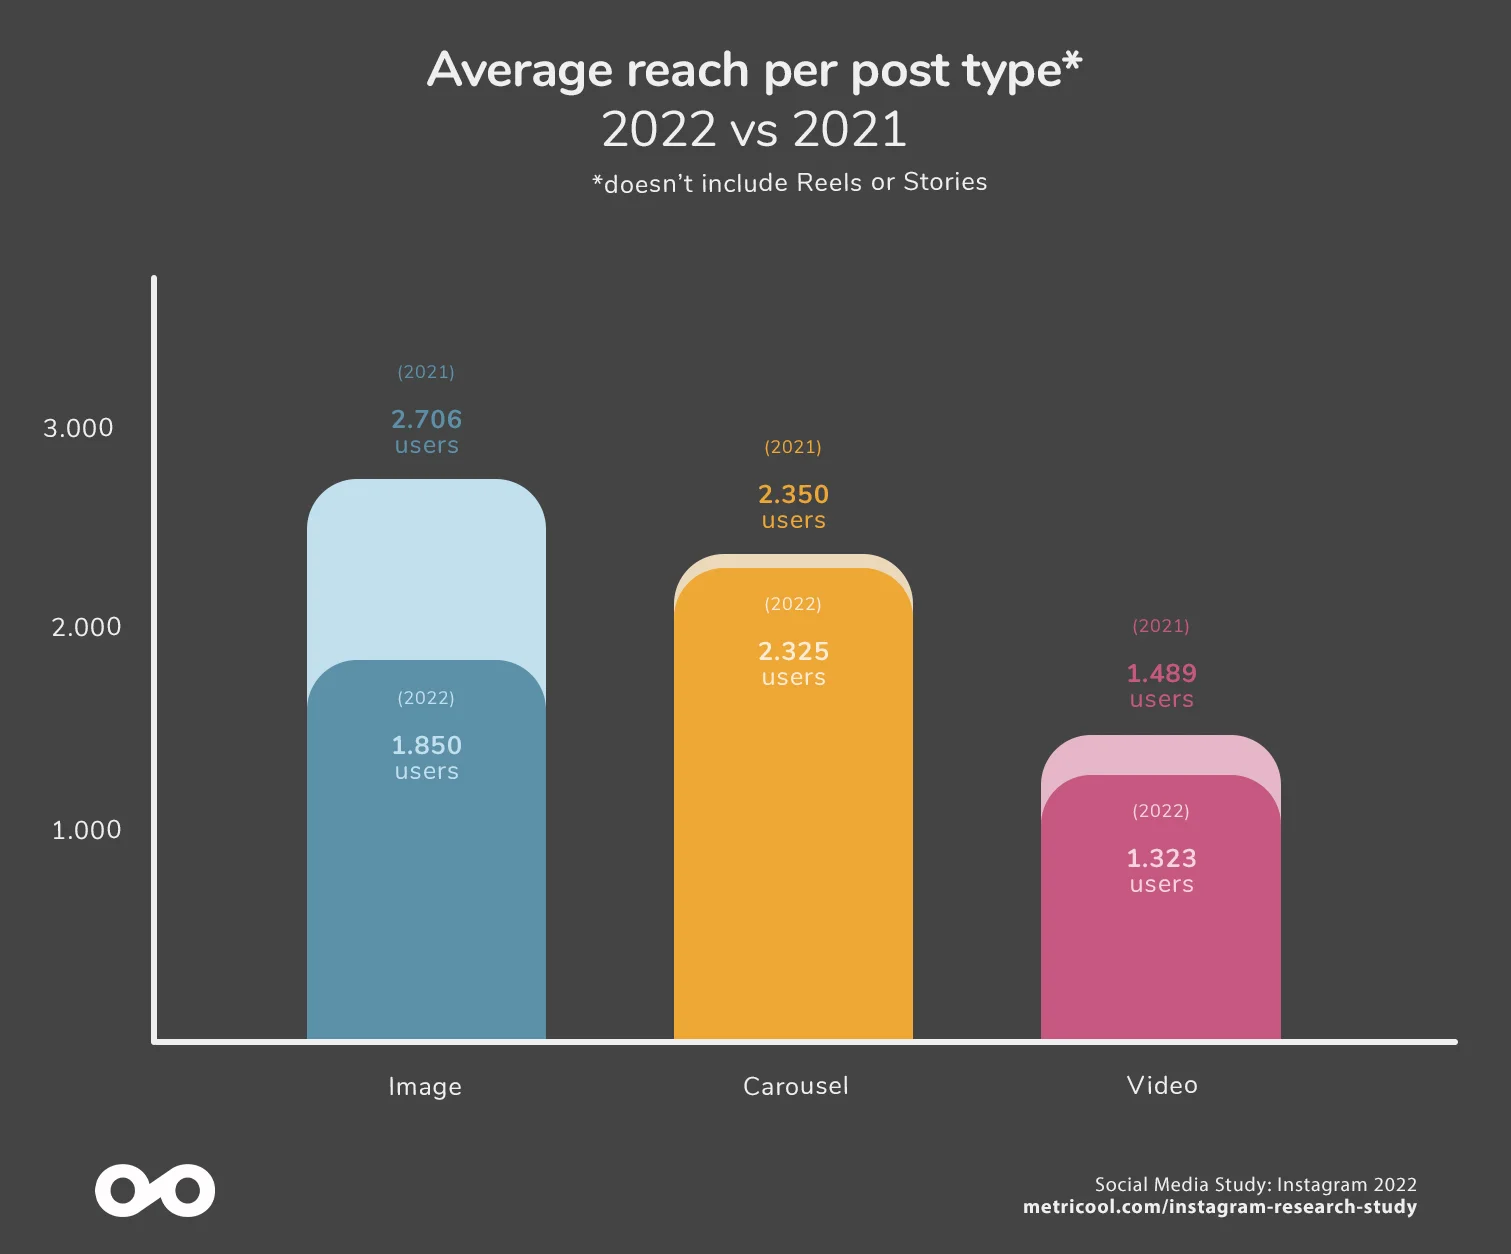
The first takeaway compared to the previous year’s study is clear: the reach of stories and posts in the feed has decreased. The reach of stories has dropped 7.49% on average, and feed posts by 22.35%
The second significant fact that has changed with respect to 2021 is that carousels have surpassed feed posts in reach by 25.71%.
Lastly, reels get between twice and 12 times more reach compared to feed posts.
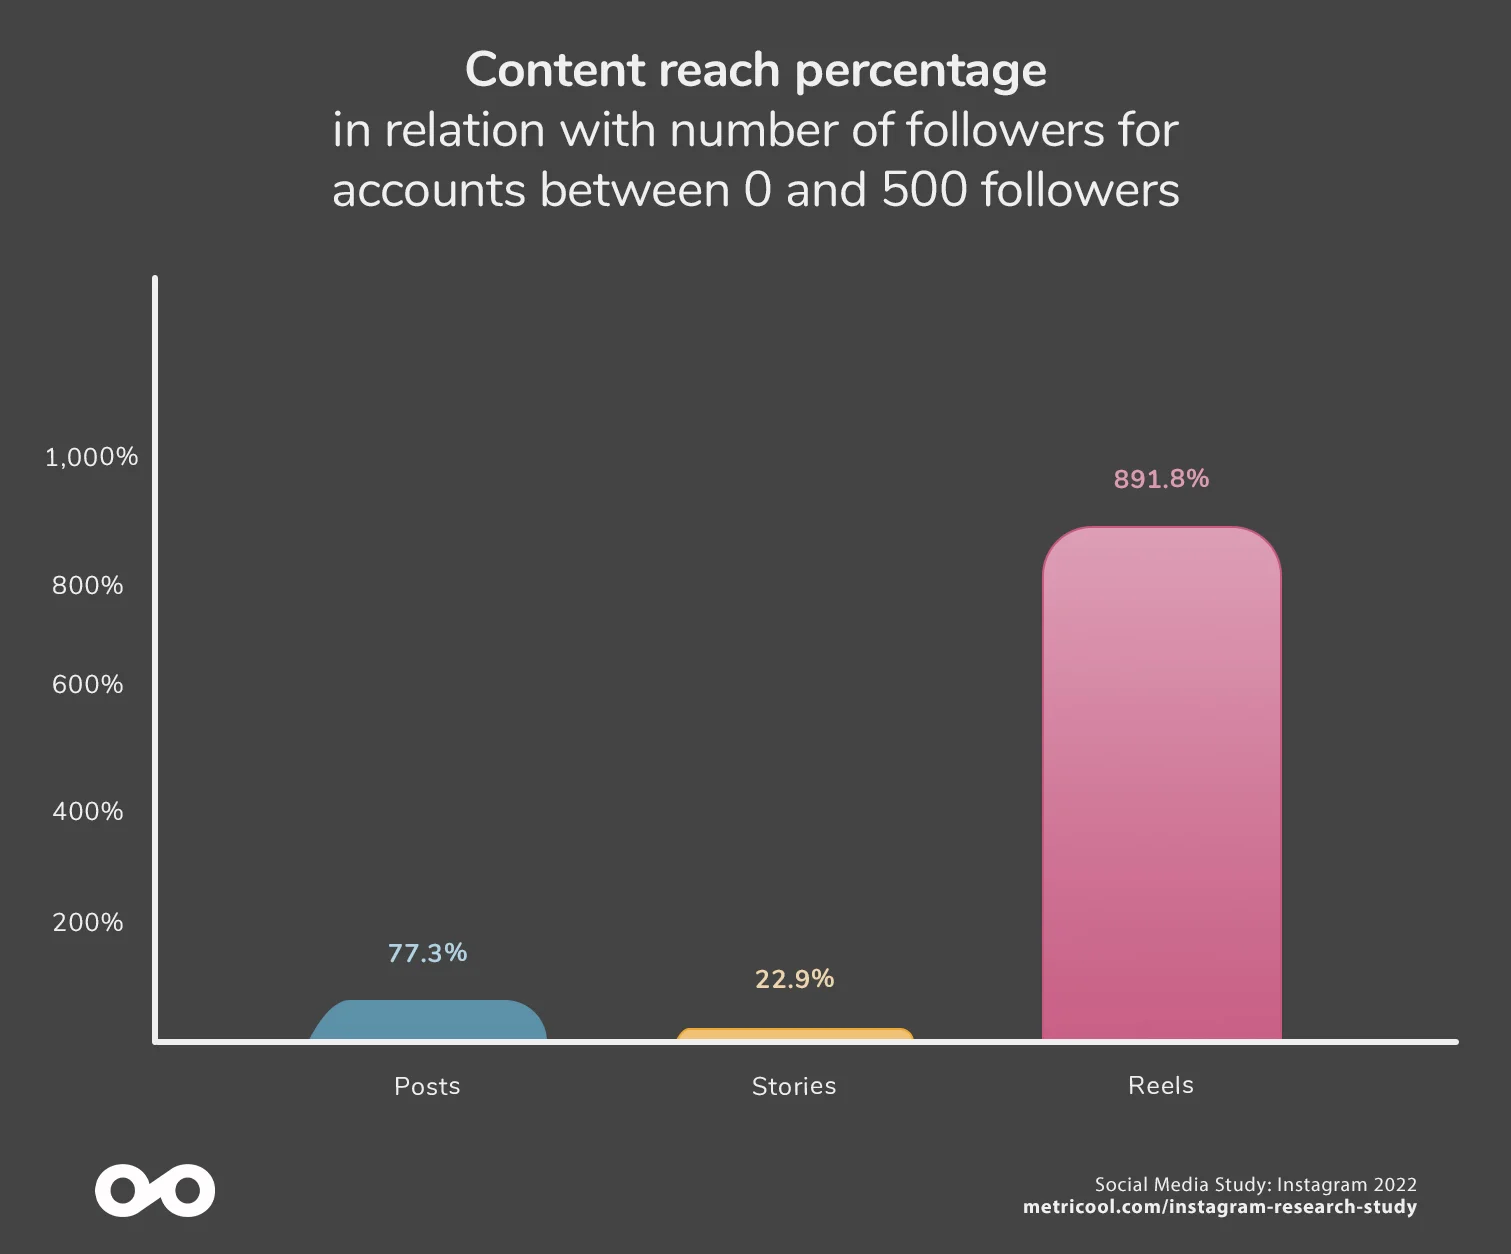
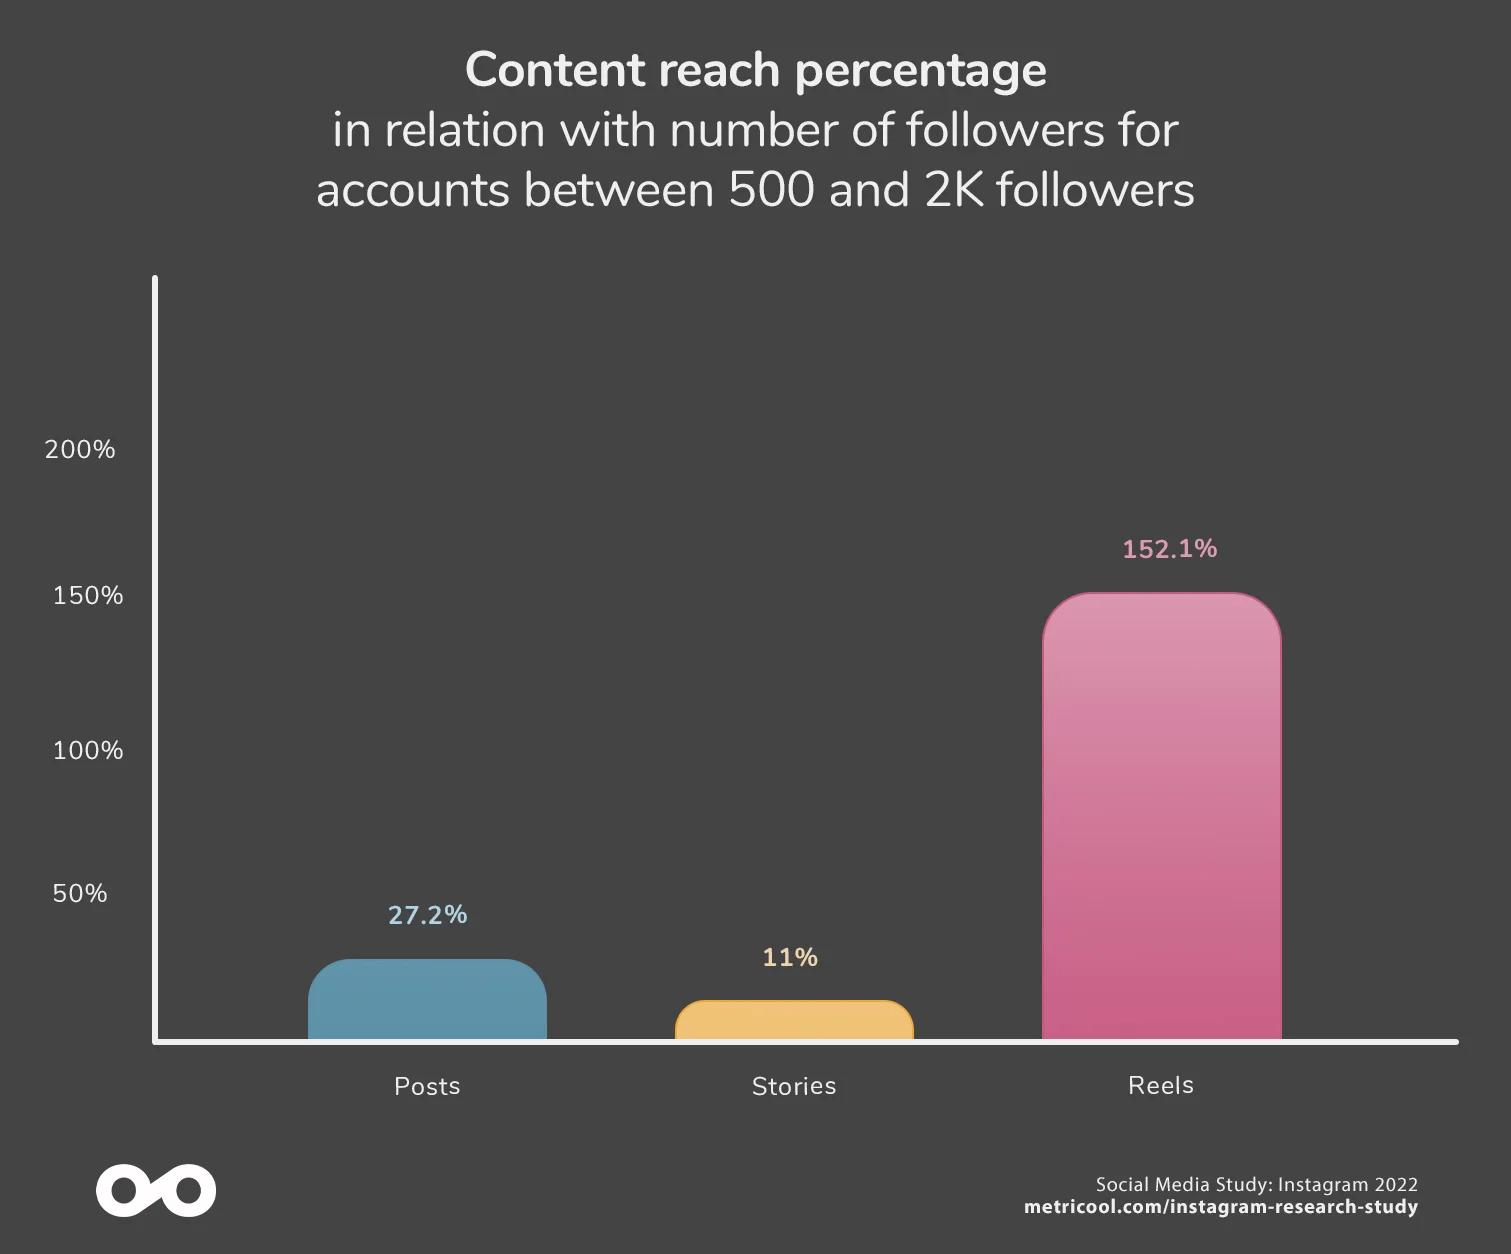
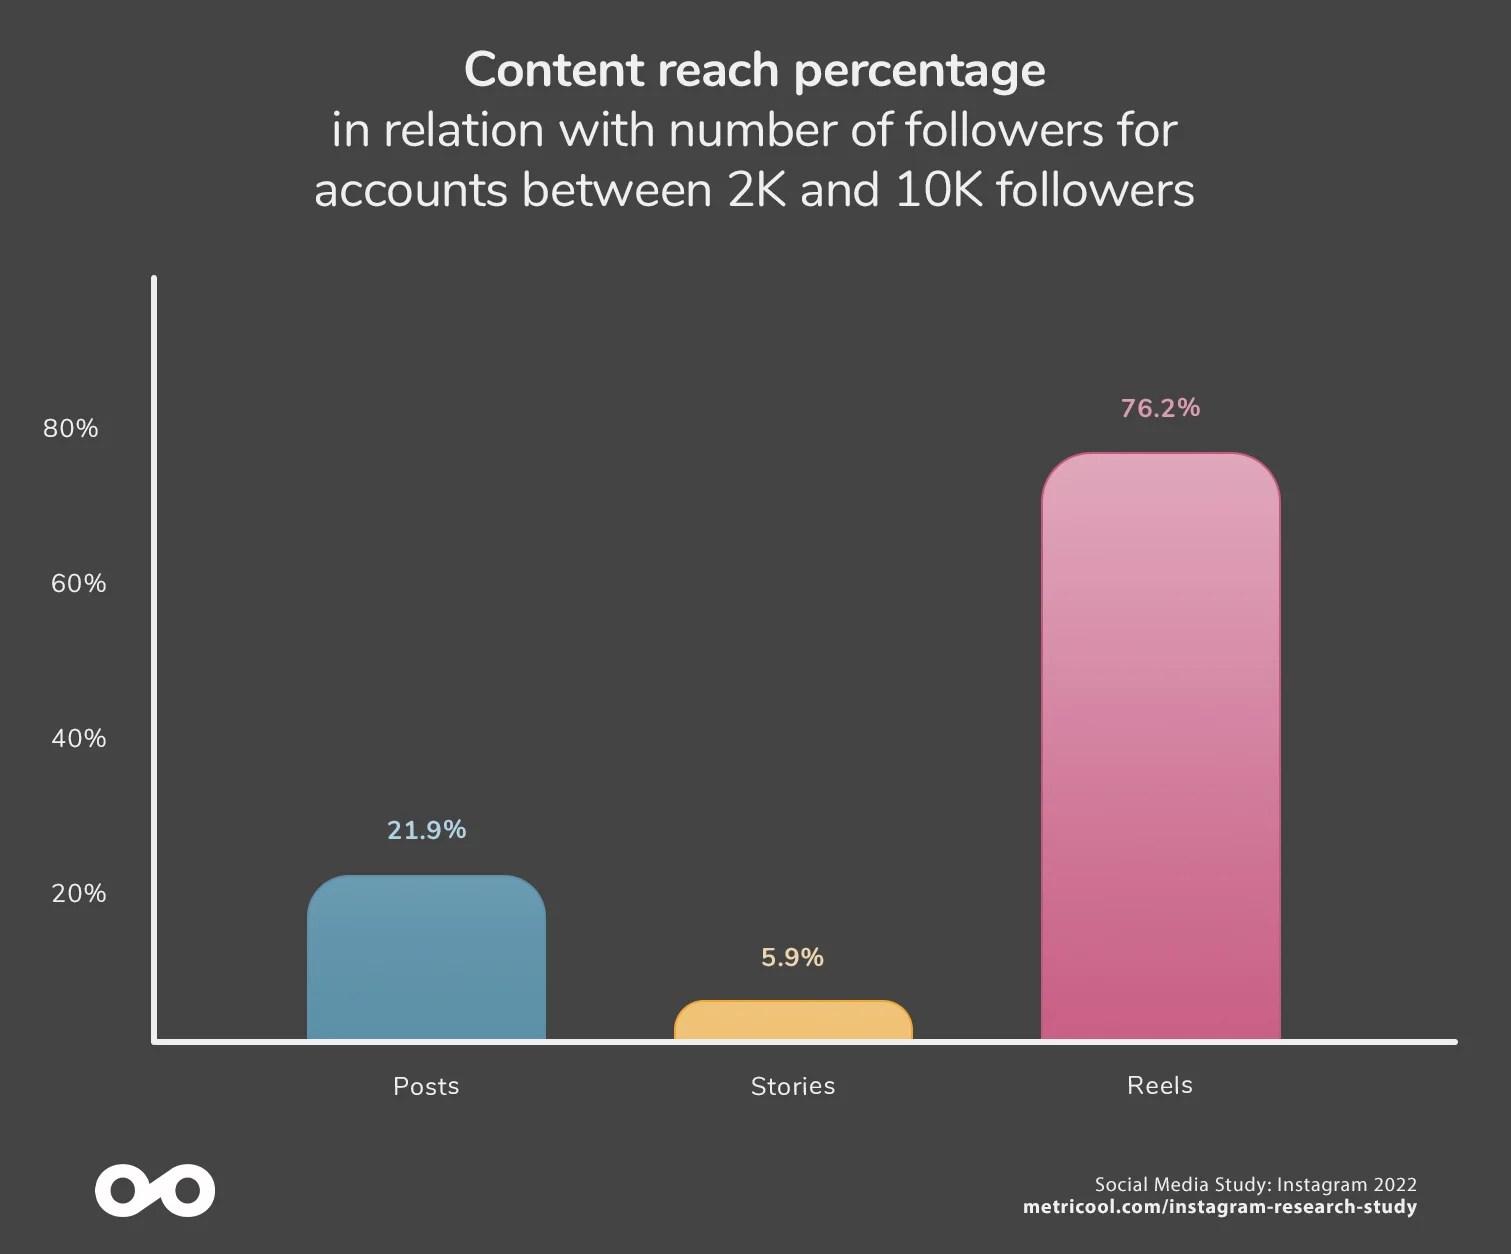
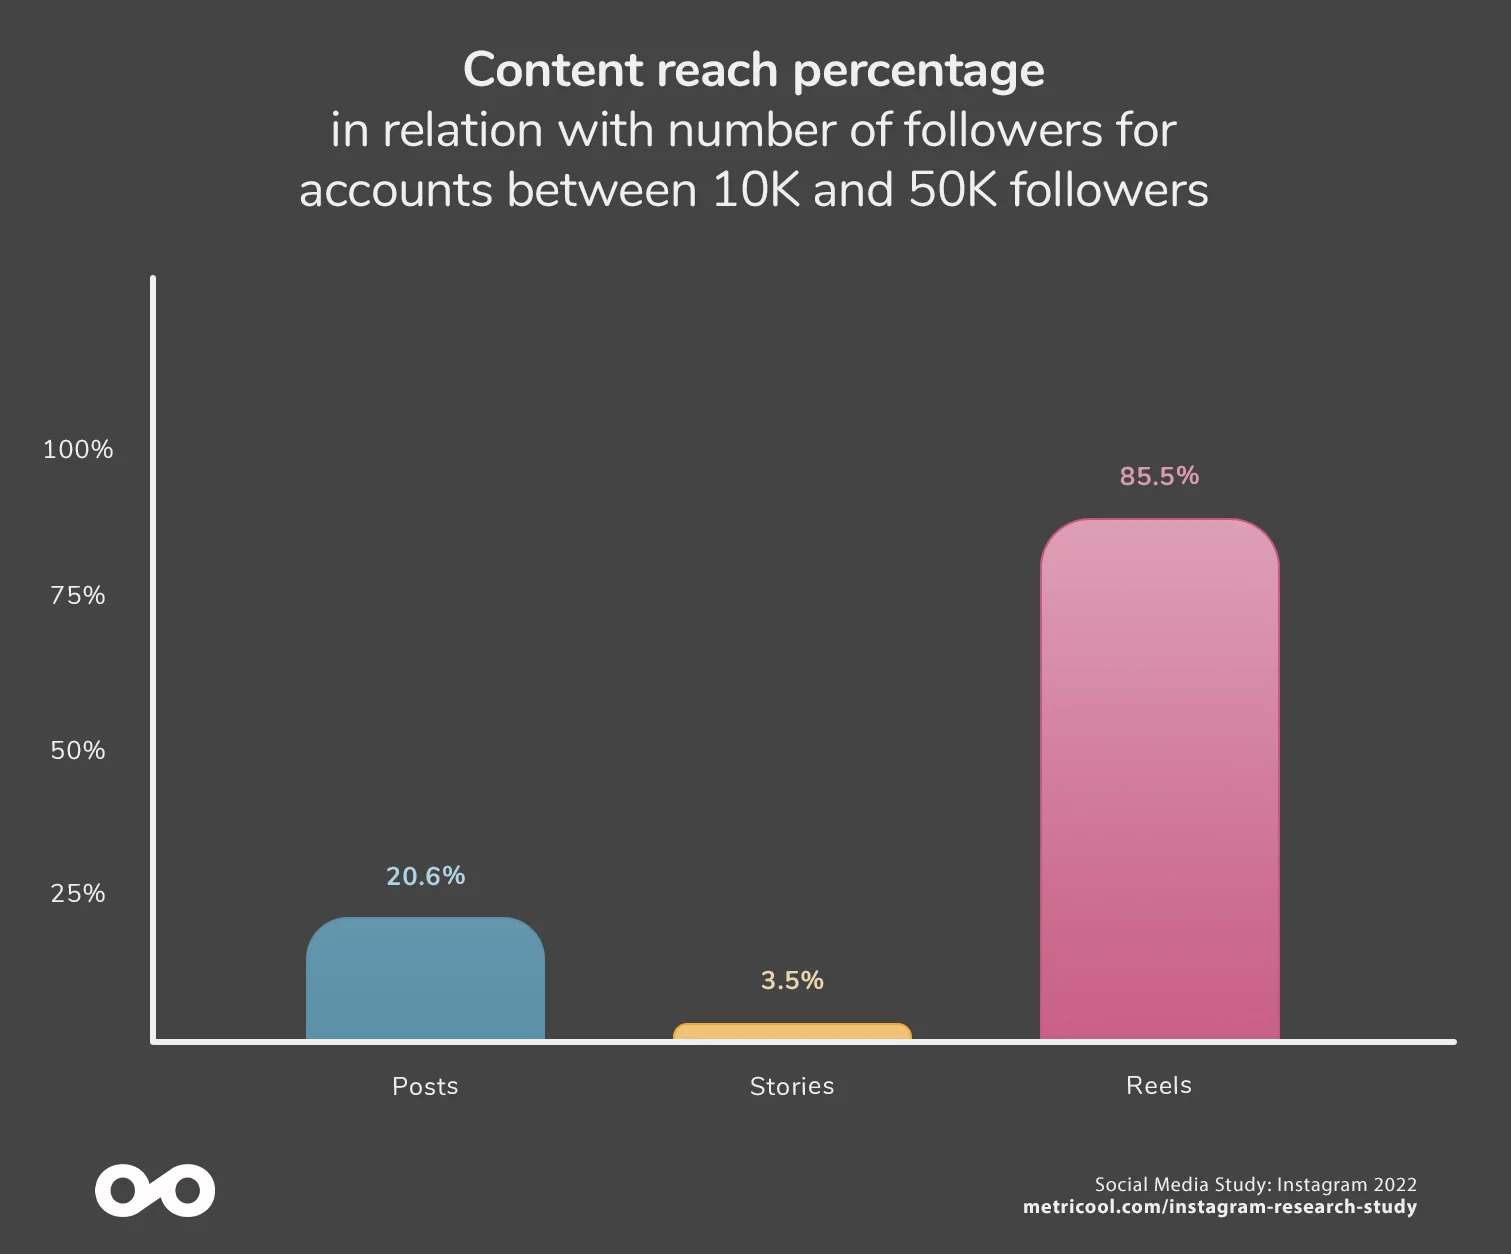
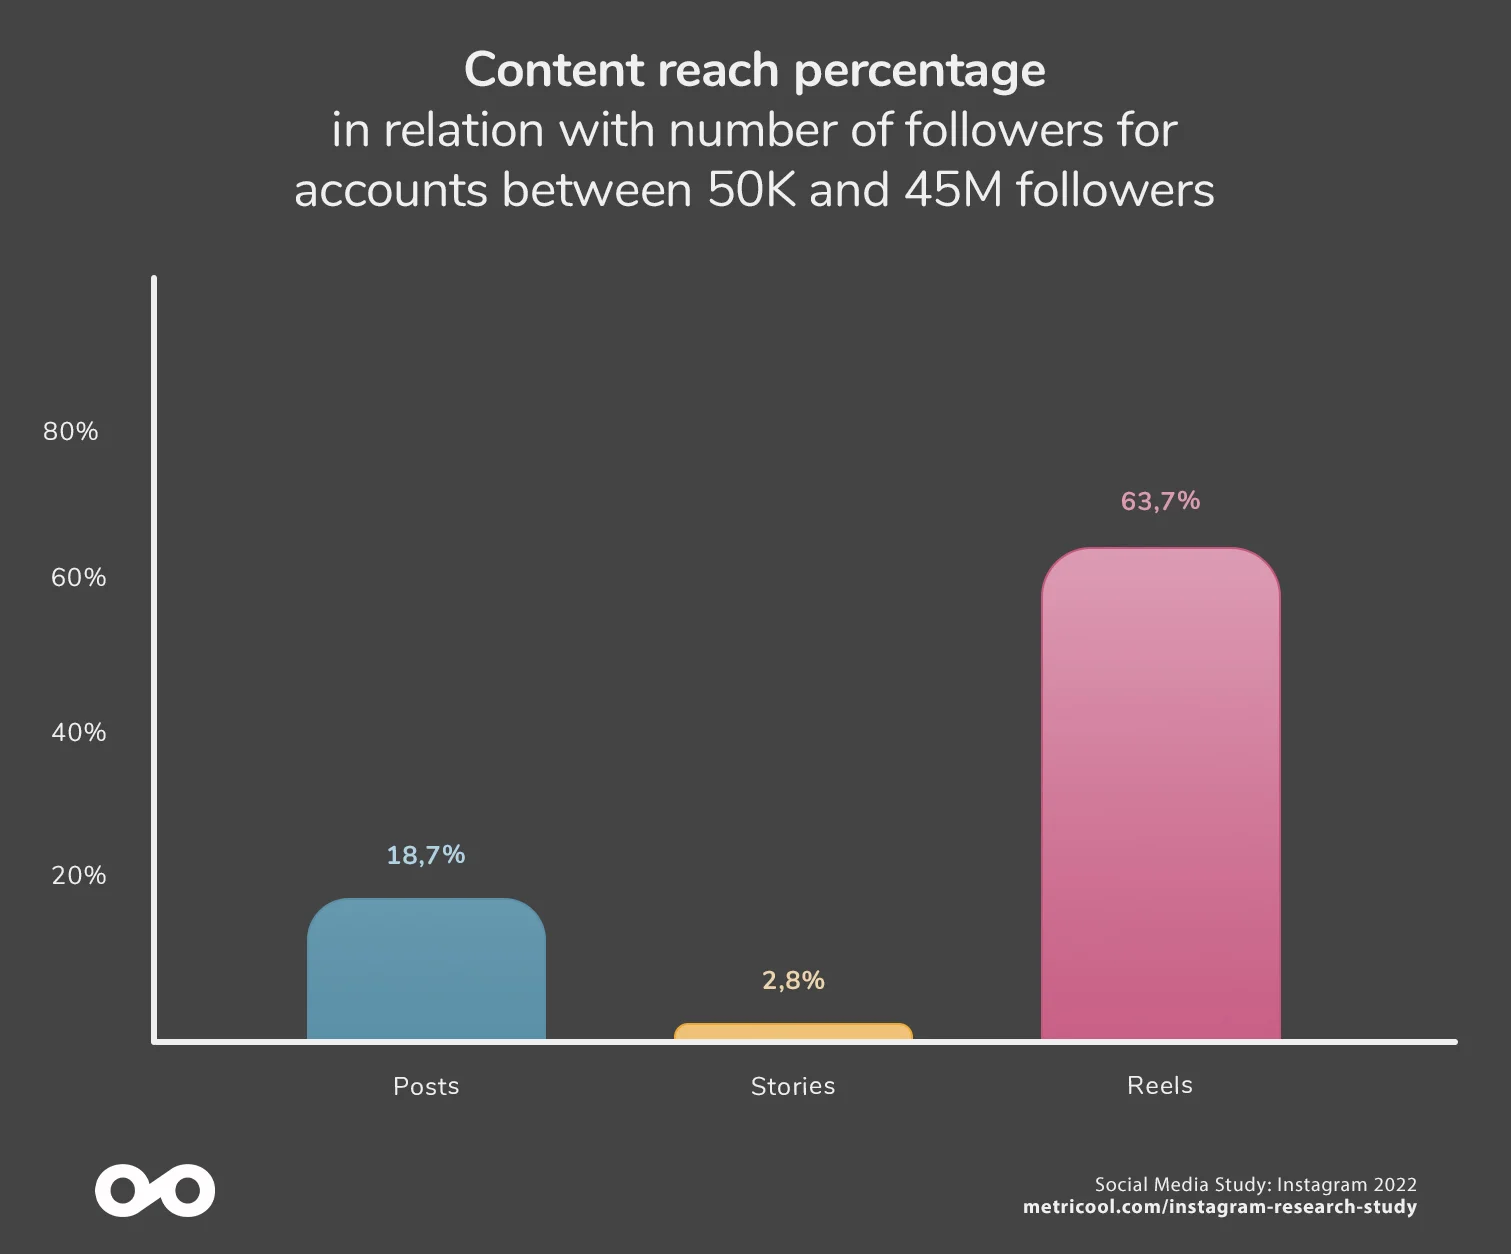
The reach of each Post, Story, and Reel has been calculated as a percentage of the number of followers. For example, if a post has reached 500 people on an account that has 1,000 followers, we will say that the post obtained a 50% reach.
We observe that accounts with 0 to 500 followers are able to reach 77.3% of their followers with feed posts, as opposed to the 2021 data, where they reached almost 85%. However, the reach of reels is 1,218 times higher than feed posts
This reach decreases proportionally as the number of followers increases.
The reach of any type of content is higher on accounts with fewer followers on Instagram.
Interactions
Reach and interactions have a correlation between them. That is, the data tend to coincide, and posts with higher reach also have more interactions.
However, the 2021 study showed a deviation with respect to carousels, which had less reach than feed posts and more interaction.
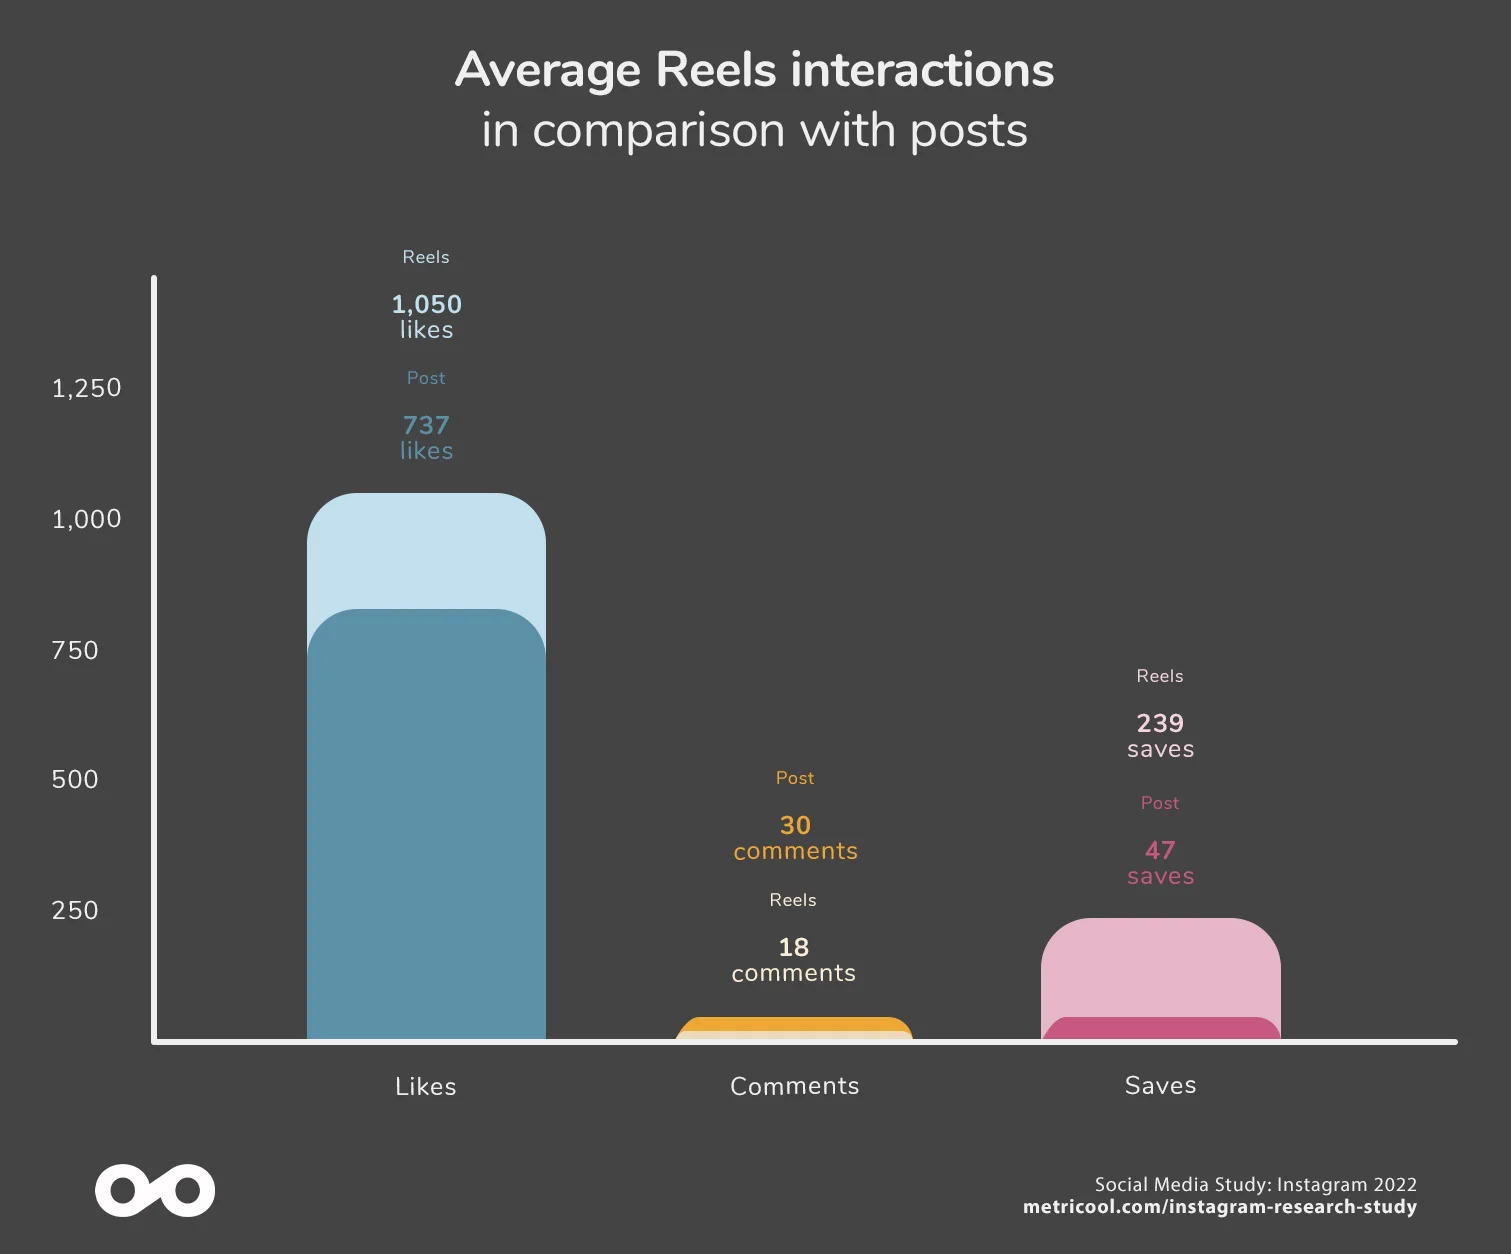
In 2022, reels have more reach and interactions than other types of content.
Therefore, the correlation between reach and interactions is also confirmed with reels. As the graph shows, reels are the far most-reaching type of content and also, enjoy more interactions.
Best time and day to post on Instagram
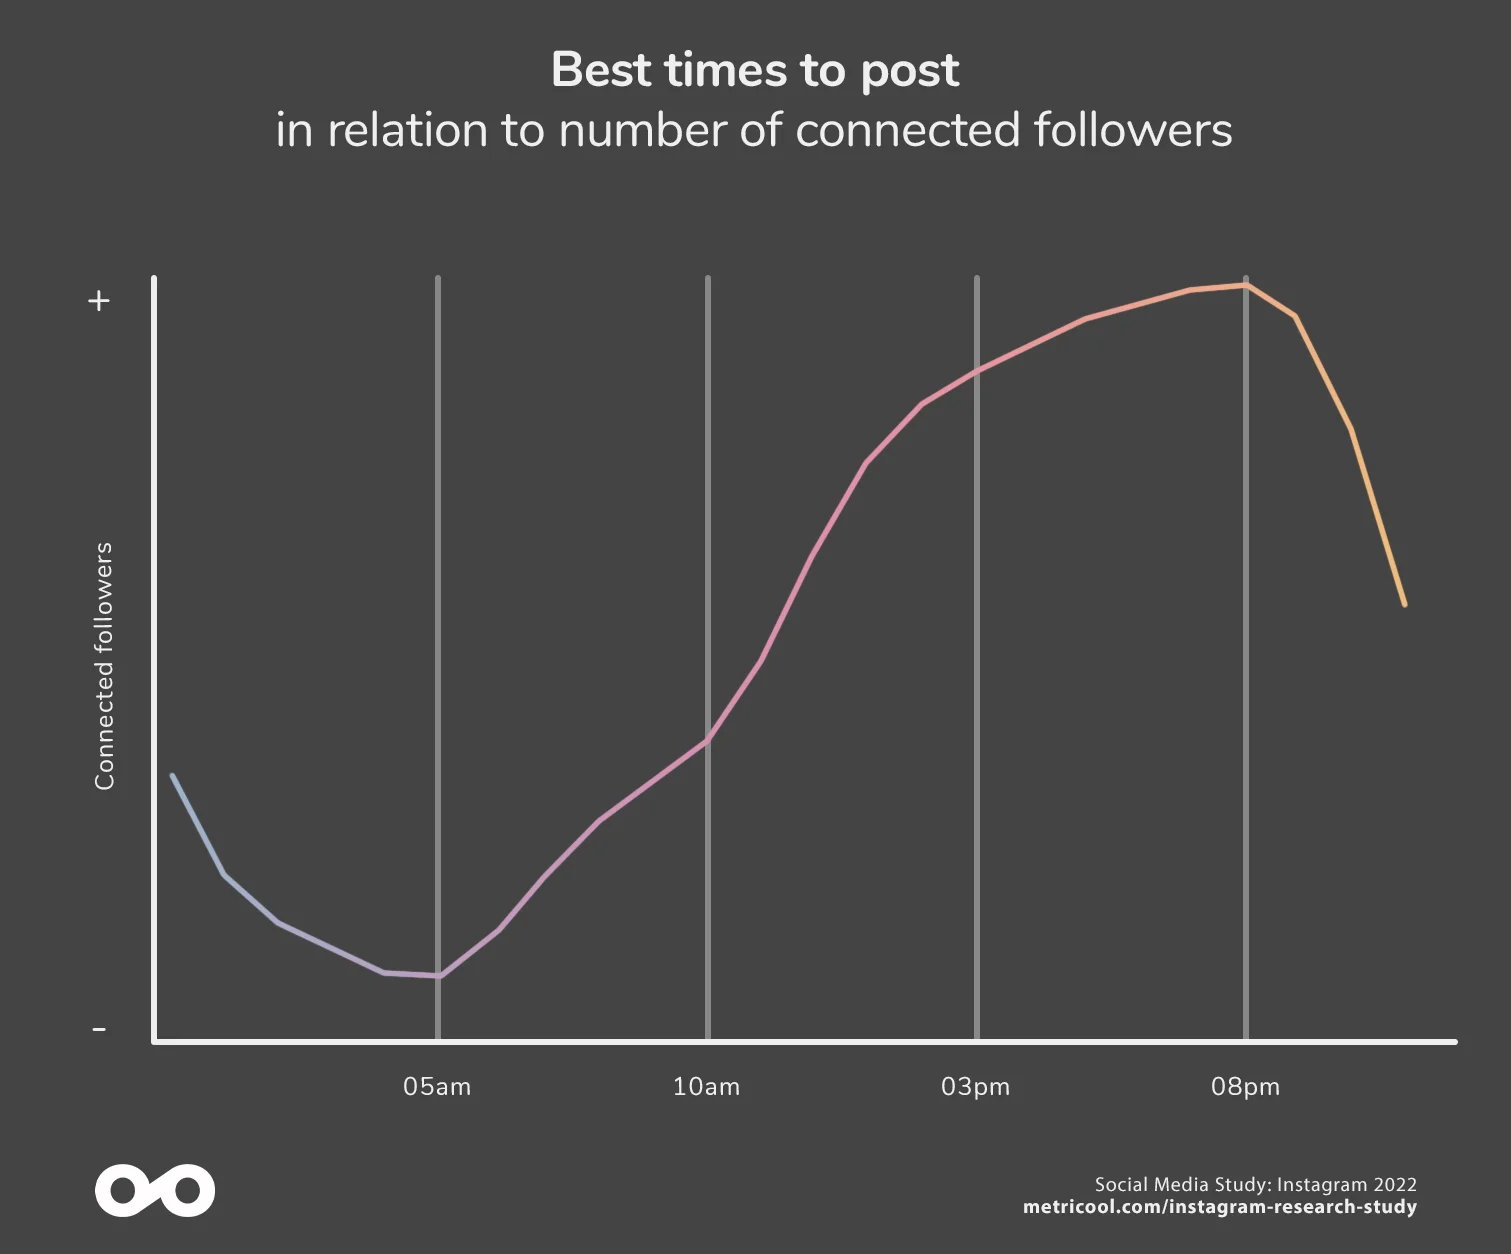
The time when most people are connected on Instagram remains the same as in 2021. The best time to post on Instagram is 8 pm, including weekends. The worst time would be 5 am, although from 10 pm there is a drastic drop.
The best days to post on Instagram are Saturday and Sunday, followed closely by Monday and Tuesday. You must look at the data in detail to point out this difference, as the variation is minimal.
And now, it’s up to you. Draw your own conclusions, apply them to your niche, and don’t forget to tell us the results.
Share this study!
Download this study with all the charts and share it with your audience. Don’t forget to mention @metricool on Instagram and on Twitter.
