LinkedIn Analytics: How to Measure Your Impact
 Alexis Turner
09 June 2026
Alexis Turner
09 June 2026 
LinkedIn has become more than a professional networking platform. It’s a place for brands to build authority, connect with the right audience, and drive measurable results. However, without tracking LinkedIn analytics, it’s difficult to understand what content is performing and where opportunties for growth exist.
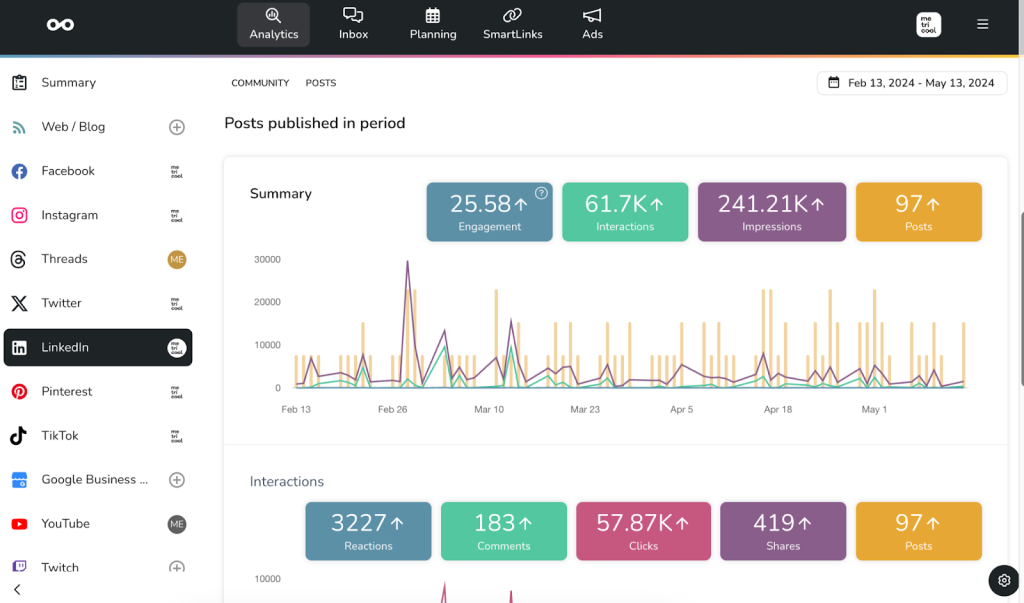
Our 2026 LinkedIn Trends Study found increases in interactions, clicks, and engagement across the platform. With Metricool, you can track LinkedIn analytics, create reports, and turn performance data into clearer content decisions. Before your next LinkedIn post, let’s explore the metrics that matter and how to use them to improve results.
Understanding LinkedIn Analytics
Did you know that marketing on LinkedIn can generate 2x higher conversion rates? This platform is unique due to its high professionalism and qualified users. It is now more than an employment site, but a complete social media platform that allows you to cultivate authentic audiences, share valuable resources, entertain an audience, and network with other professionals.
Learning who your audience is, what they are looking for, and how to best engage them lies in the data. Through demographic, performance, and growth metrics, these answers uncover themselves. So, what are the most important LinkedIn analytics?
Let’s break the metrics into four categories –– audience, content performance, growth, and competitor metrics. Depending on your goals, you can measure the metrics that measure these goals.
LinkedIn demographic metrics
These metrics define who your audience is and how to target them. Within LinkedIn, you can view your demographic analytics in your profile dashboard. If you are a page admin, you can select “View as admin” to see a breakdown of your analytics.
When analyzing your page, select a custom date range of up to one year.
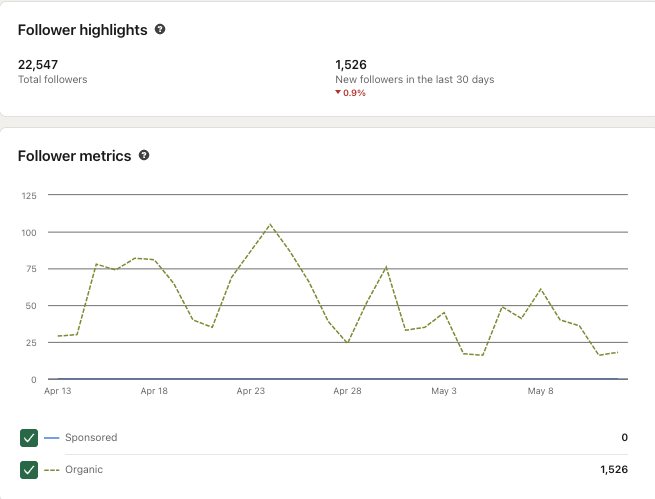
By clicking the “Followers” tab, you can see an evolutionary graph of your total followers and new followers over the last 30 days.
Below, view your follower demographics by the following filters:
- Job function
- Company size
- Industry
- Location
- Seniority
This information will help you create more valuable content for your niche audience. With this data, you can understand the job positions, industries, and cities they live in.
You can view your followers at the bottom of the page to connect with them and better understand what they seek.
LinkedIn Visitor Analytics
Have you ever wondered who’s checking out your LinkedIn company page, even if they’re not following you? That’s where visitor analytics come in handy! It’s like having a behind-the-scenes peek at who’s interested in your content and what makes them tick.
- Who’s stopping by? Track your page views and unique visitors to see how many people are actually landing on your page (and coming back for more!)
- The scoop on your audience: Find out what kind of folks are interested in your content – super helpful for knowing who you’re really talking to
- Engagement detective work: See what content gets people clicking and interacting – because let’s face it, that’s what we’re all after
- Phone vs computer browsing: Know how your audience likes to scroll through your content, so you can make sure it looks awesome no matter what device they’re using
- Think of it as your secret weapon for creating content that actually resonates with your audience. The more you know about who’s checking you out, the better you can tailor your content to keep them coming back for more!
LinkedIn content performance metrics
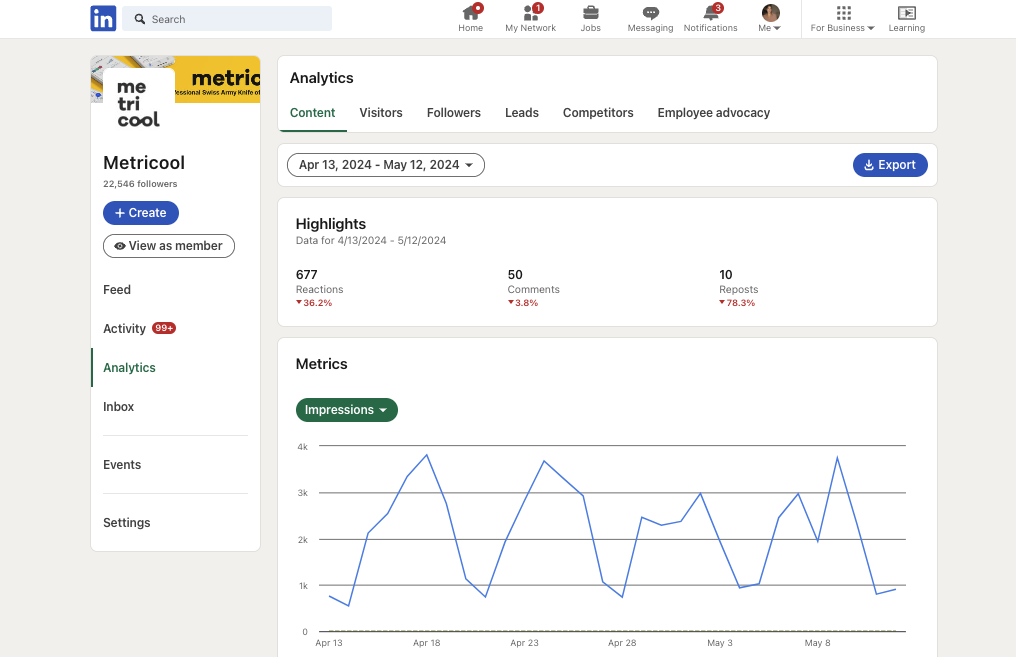
When viewing how your content has performed, you will see a graph showing the evolution of the selected metric. At the top of this page, view your overall performance highlights – reactions, comments, and reposts.
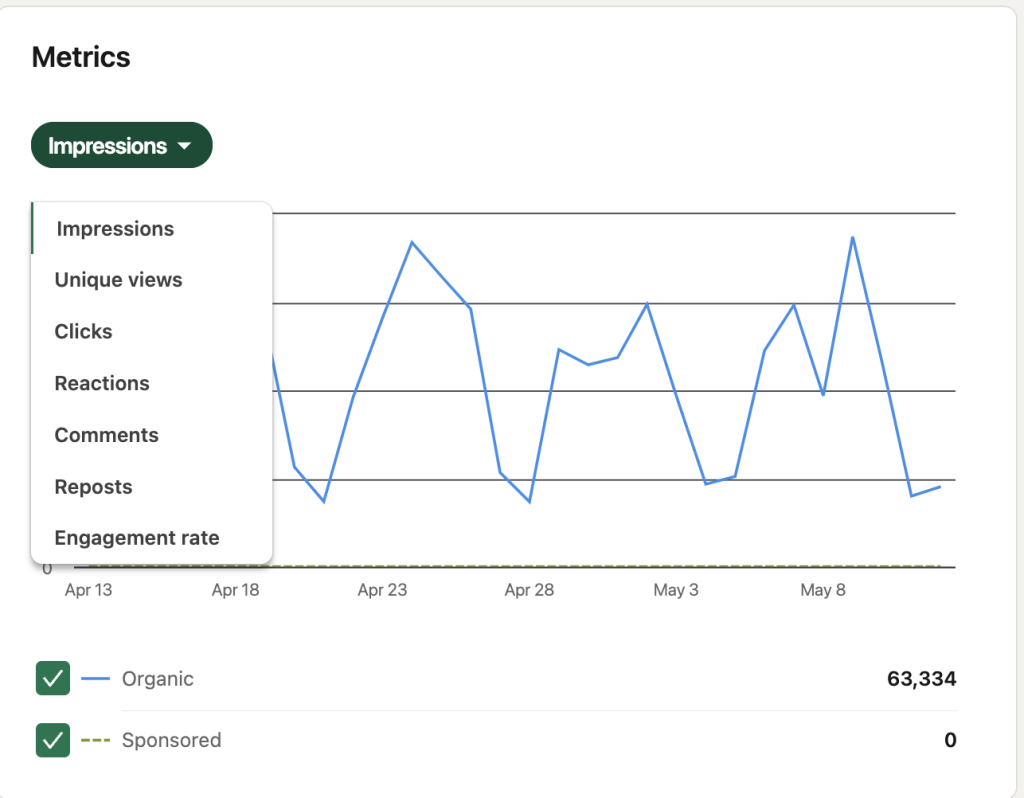
You can also measure per the following metrics:
- Impressions
- Unique views
- Clicks
- Reactions
- Comments
- Reposts
- Engagement rate
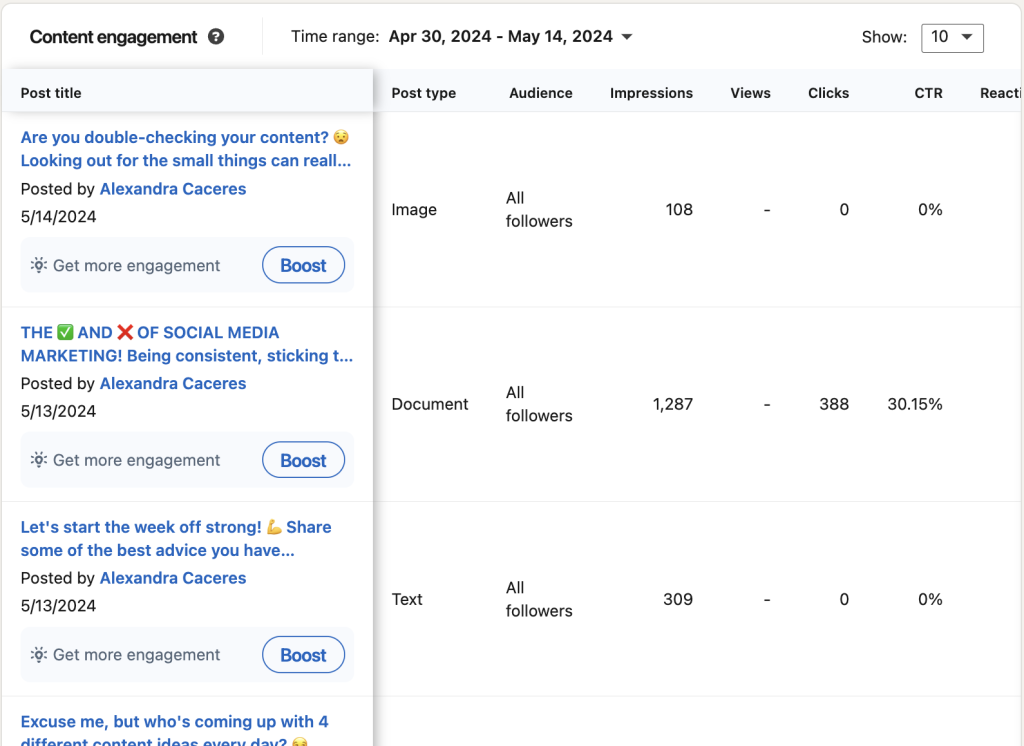
Below this graph, you will see a Content engagement section, with a breakdown of your top-performing posts. This shows:
- Post type
- Audience
- Impressions
- Views
- Clicks
- CTR
- Reactions
- Comments
- Reposts
- Follows
- Engagement rate
LinkedIn page growth metrics
By clicking on the “Visitors” tab, you can see an evolutionary graph of your page views, unique visitors, and custom button clicks. When viewing the graphs, filter by the page views or unique visitors, and then select the page – Home, About, Insights, and People.
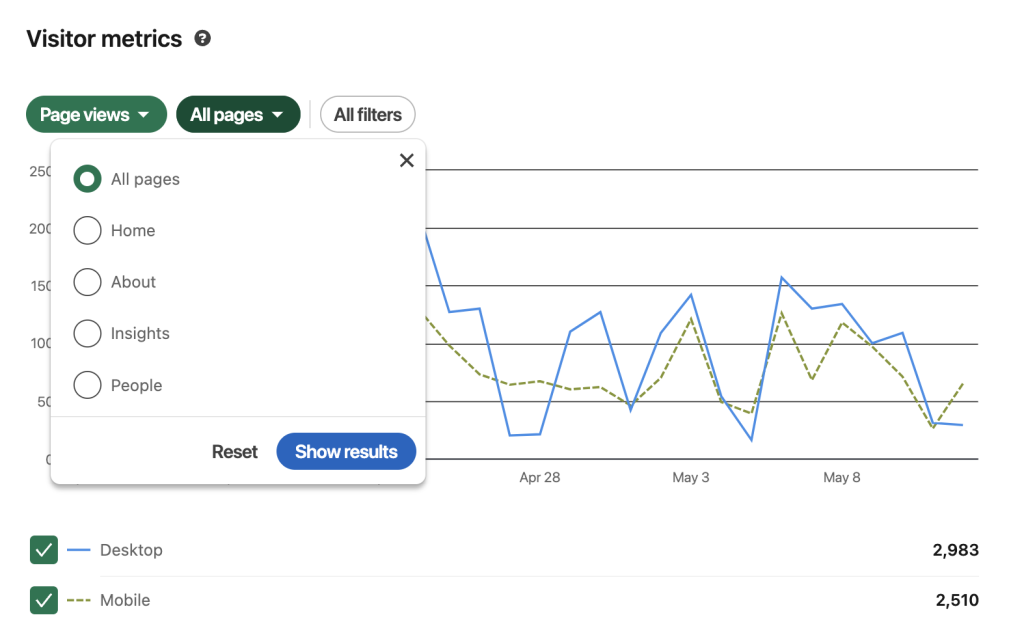
As you can see in the graph, you can view results for both desktop and mobile versions. In this tab alone, you have powerful information about which pages are gaining the most visibility and how many people view your page.
Below, view your visitor demographics by the following filters:
- Impressions
- Unique views
- Clicks
- Reactions
- Comments
- Reposts
- Engagement rate
LinkedIn competitor metrics
Lastly, on LinkedIn, you can view your main competitors’ performance. View your competitor’s new follower count, engagement rate evolution, number of posts published, and trending competitor posts per the period.
Underneath the number figures, you will see the change percentage and a green or red arrow indicating a growth or decline.
LinkedIn Analytics Benchmarks
Knowing which analytics to track is pointless if you have no idea what the acceptable performance level for each metric is. In our 2026 LinkedIn Study, we analyzed over 670,000 posts. Here are the (per post) performance metrics we found:
- Impressions: 831.96
- Interactions: 115.63
- Clicks: 102.32
- Likes: 11.67
- Comments: 0.49
- Shares: 1.16
- Engagement: 13.90%
These numbers were achieved from an average of 2.34 posts per week, down from last year’s average of 2.6. Impressions, likes, comments, and shares all fell by over 10%, while interactions (2.43%), clicks (4.9%), and engagement (13.82%) rose.
2026 Format Performance for Company Pages
| Image | Video | Multi-image | Carousel | Text | Newsletter | Poll | |
| Impressions | 952.90 | 667.87 | 1,005.91 | 1,234.18 | 649.89 | 648.27 | 3,418.57 |
| Interactions | 54.98 | 46.176 | 380.48 | 611.15 | 41.33 | 27.96 | 143.98 |
| Clicks | 39.14 | 34.03 | 359.60 | 593.97 | 34.74 | 14.51 | 138.65 |
| Likes | 13.87 | 10.62 | 18.93 | 14.65 | 5.79 | 11.77 | 4.06 |
| Comments | 0.64 | 0.41 | 0.61 | 0.56 | 0.26 | 0.61 | 0.76 |
| Shares | 1.33 | 1.11 | 1.34 | 1.98 | 0.53 | 1.08 | 0.50 |
| Engagement | 5.77% | 6.91% | 37.82% | 49.52% | 6.39% | 4.31% | 4.21% |
| Posts/week | 1.26 | 0.98 | 0.64 | 0.63 | 0.48 | 0.48 | 0.41 |
With Metricool, you can view LinkedIn analytics related to content formats to understand how effective your posts are. As we can see in the table above, image posts are by far the most common. However, when it comes to performance, carousels are leading the way, with the most interactions, clicks, shares, and engagement.
Turn LinkedIn Analytics Into Actionable Reports With Metricool
Tracking metrics is only half the process. Once you know which numbers matter, the next challenge is organizing them into reports that help teams, clients, and stakeholders make decisions faster. Metricool’s reporting tools bring your LinkedIn analytics into one place so you can move beyond basic screenshots and bulky spreadsheets.
Metricool Studio: Build Custom Analytics Views Without Technical Know-How
Metricool Studio lets you create reporting views tailored to the metrics that matter most. Choose the charts, KPIs, and insights you want to display and build dashboards without needing technical knowledge. Whether you manage one LinkedIn page or multiple brands at once, Metricool Studio allows you to combine performance data into a single workspace so trends and opportunities are easier to spot and tap into.
Campaign Dashboards: Measure Performance Beyond Individual Posts
Content performance tends to become more valuable when it is viewed as a part of a larger initiative. Metricool’s campaign dashboards allow you to group content by campaign, launch, topic, or objective. Instead of reviewing posts one by one, you can analyze combined performance to understand the true impact of your campaigns across LinkedIn.
This makes it easier to answer questions such as:
- Which campaign generated the most engagement?
- Which content theme drove the most clicks?
- Which campaign initiatives contributed most towards your growth?
Automated Reports That Save Time
Once your analytics are organized, Metricool lets you generate professional reports in minutes using data from the social networks you select for a specific date range. Customize reports with your logo and brand colors, then export them as PDF or PPT to share with teams, leadership, or clients. This creates a faster reporting strategy while keeping performance updates consistent and presentation-ready.
How to Use LinkedIn Analytics to Measure Success
As you build your LinkedIn marketing strategy, keeping your main objectives and goals at the forefront will help you stay focused and allow you to measure growth accurately. Then, you can use the above metrics to see if you are meeting these goals.
You can create monthly social media reports to keep track of your monthly evolution and share them with your team or client. Then, depending on your numbers you can tweak your content marketing strategy
LinkedIn Analytics Tool: Metricool
Stop the platform-hopping headache and start managing your social media like a pro. Here is how Metricool turns your LinkedIn strategy into a streamlined powerhouse:
- Everything Under One Roof: Ditch the constant tab-switching. Manage all your profiles, schedule content, auto-publish, and handle your DMs and comments from a single, centralized dashboard.
- Deep-Dive LinkedIn Insights: Get a crystal-clear view of your community growth and content performance. Our easy-to-read graphs make professional analytics accessible for everyone, from beginners to experts.
- Granular Post Data: We break down the “why” behind your success. See exactly how your top posts perform with metrics on reactions, clicks, shares, impressions, and even detailed video watch-time stats.
- Automatic Professional Reporting: Say goodbye to manual spreadsheets. Generate visually stunning PDF or PPT reports in seconds. You choose the period, metrics, and branding—we do the heavy lifting.
- Custom Branding & Automation: Advanced and Enterprise users can fully white-label reports with custom colors and backgrounds. Plus, you can automate them to land in your client’s or coworker’s inbox on the same day every month.
- Strategic Growth: By identifying patterns in your data, you can stop guessing and start creating content that your audience actually loves.
- Affordable Excellence: While Metricool offers a free version, connecting your LinkedIn account is a Premium feature. We keep our costs low so you can keep your ROI high.
Measure, Report, and Improve Your LinkedIn Results With Metricool
Turning your LinkedIn analytics into actionable insights drives better results. With Metricool, you can build tailored dashboards, group content performance with campaign dashboards, and generate professional reports using the social network data and date ranges you choose. Register for a Metricool account to access LinkedIn analytics, customizable reporting tools, and a complete view of your performance across the top social media platforms.
