2026 LinkedIn Statistics for Social Media Marketers
 Gretchen Oestreicher
23 April 2026
Gretchen Oestreicher
23 April 2026 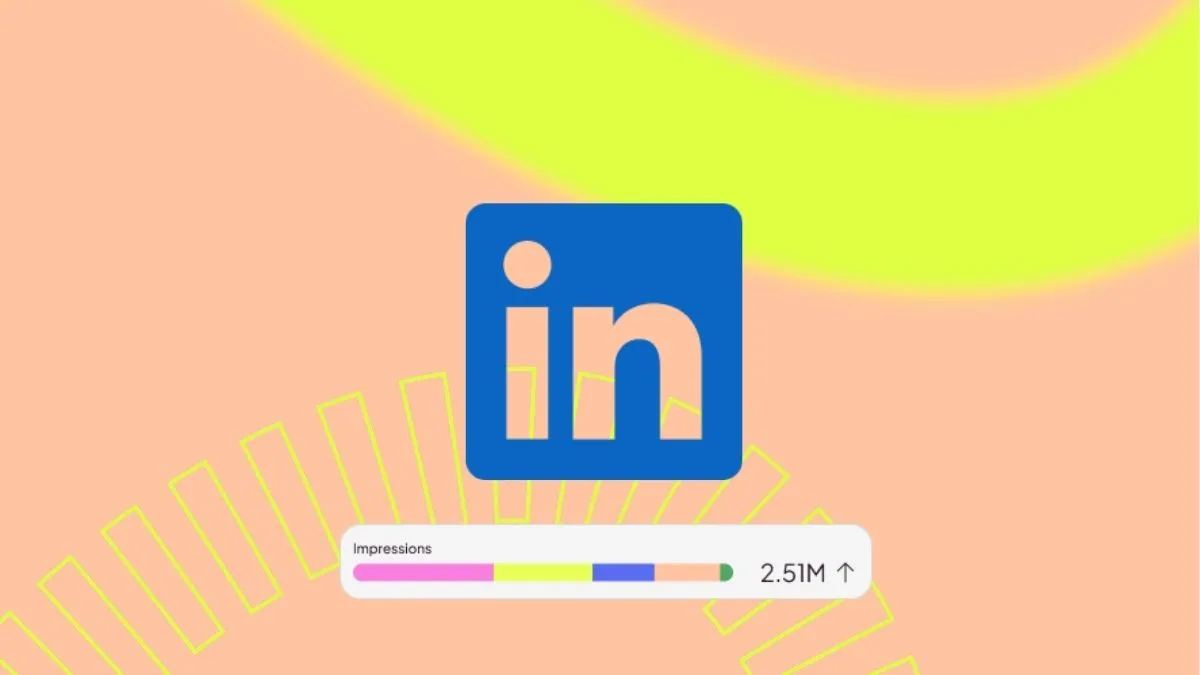
LinkedIn is a vital platform for B2B marketers, offering tons of opportunities for lead gen, networking, and content marketing. With over 1 billion users across 200 countries, it’s the go-to platform for professionals and businesses. When you’re trying to navigate this world of opportunity, data is the only reliable compass. That’s why we’ve compiled these LinkedIn statistics with data from our 2026 LinkedIn Study and our 2026 Social Media Study, along with external sources. We’ll break down key LinkedIn engagement and follower statistics for company pages and personal profiles, so you can align your strategy and hit your target audience more effectively.
Key LinkedIn User Statistics
- LinkedIn has over 1 billion total members across 200 countries around the globe.
- Linked has about 310 million monthly active users.
- LinkedIn earned US$16.37 billion in revenue in 2024.
- LinkedIn is the 17th most visited website in the world.
2026 LinkedIn Performance Stats
The overall trend for LinkedIn in 2026 is one of efficiency. Users are posting less frequently, but the engagement they receive per post is becoming more concentrated. Let’s look at the core LinkedIn engagement stats that define the current state of the platform.
| Metric | 2025 | 2026 | % Change |
| Impressions | 924.42 | 831.96 | -10% |
| Interactions | 112.89 | 115.63 | +2.43% |
| Clicks | 97.54 | 102.32 | +4.90% |
| Likes | 13.47 | 11.67 | -13.39% |
| Comments | 0.59 | 0.49 | -16.89% |
| Shares | 1.29 | 1.16 | -10.43% |
| Engagement | 12.21% | 13.90% | +13.82% |
| Posts per Week | 2.60 | 2.34 | -9.82% |
Source: Metricool 2026 LinkedIn Study
Analyzing the Shift: Quality Over Quantity
The most striking figure in these LinkedIn statistics is the 10% drop in impressions alongside a 13.82% increase in engagement. This tells us that LinkedIn is becoming more selective about who sees your content. While your total reach might be slightly lower than last year, the people who do see your posts are much more likely to interact with them.
LinkedIn Company Page Stats: The Business Reality
For brands, the environment has become more challenging but also more rewarding for those who focus on high-value content. The LinkedIn company page stats from our 2026 study show that businesses are pulling back on the volume of their posts to focus on better performance per post. Here are some of the company page stats we found for b2b benchmarking.
LinkedIn Companies: General Data Trends
| Metric | 2024 | 2025 | % Change |
| Weekly Frequency | 2.88 | 2.74 | -5% |
| Impressions | 1,057.13 | 812.64 | -23% |
| Interactions | 16.60 | 14.16 | -14% |
| Comments | 0.59 | 0.48 | -18% |
| Likes | 14.62 | 12.48 | -14% |
| Shares | 1.39 | 1.20 | -13% |
| Engagement | 1.57% | 1.74% | +11% |
Source: Metricool 2026 Social Media Study
LinkedIn Personal Profile Stats: The Power of the Individual
One of the most common questions in social media management is whether to prioritize the company page or the personal profiles of the leadership team. Our 2026 LinkedIn study provides clear LinkedIn personal profile stats that help answer this.
Personal Profile Performance (Per Post)
- Impressions: 817.67
- Interactions: 14.44
- Engagement: 2.60%
- Posts per Week: 3.05
When we compare these to company pages, a clear picture emerges. Personal profiles have a significantly higher engagement rate (2.60%) compared to company pages (1.74%). Furthermore, individuals are posting more frequently (3.05 times per week) than companies (2.74 times per week).
People want to connect with people. In 2026, the human element of LinkedIn is its strongest asset. Personal profiles generate more interactions per impression because they feel more authentic and less like a marketing broadcast. If your LinkedIn business stats are stalling, the solution may be to empower your team members to share insights from their own profiles.
LinkedIn Engagement Stats by Account Size
Not all accounts are treated equally by the algorithm. To understand how to increase reach on Instagram or LinkedIn, you must look at your specific tier. The 2026 data shows that “Huge” accounts are seeing a massive resurgence in engagement, while “Big” accounts are struggling.
Company Page Engagement Evolution (2025 vs. 2026)
| Account Size | Engagement Change | Post Frequency Change |
| Tiny (<2K followers) | +38.83% | -5.26% |
| Small (2K – 10K followers) | +23.17% | -12.30% |
| Medium (10K – 100K followers) | +11.42% | -13.48% |
| Big (100K – 1M followers) | -6.98% | -18.59% |
| Huge (>1M followers) | +94.76% | -50.42% |
Source: Metricool 2026 LinkedIn Study
The most shocking statistic is the 94.76% increase in engagement for accounts with over one million followers, despite those accounts cutting their posting frequency in half (-50.42%). This suggests that once an account reaches a certain level of authority, the algorithm prioritizes rare updates heavily.
For the rest of us, the news is also positive. Tiny, Small, and Medium accounts all saw double-digit increases in engagement while also reducing their posting frequency. This confirms that the platform is currently favoring a “less is more” approach. If you are a small brand, you do not need to post five times a week to stay relevant. In fact, cutting back slightly may actually help your engagement rate grow.
LinkedIn Follower and Demographic Statistics
Growth is not distributed evenly. Our LinkedIn follower stats show that smaller accounts are finding it much easier to attract new followers than the platform’s giants.
Percentage of LinkedIn Company Pages that Grew in 2025
- Overall: 6.89%
- Tiny (<2K followers): 7.13%
- Small (2K – 10K followers): 7.97%
- Medium (10K – 100K followers): 2.89%
- Big (100K – 1M followers): 1.19%
Our 2026 LinkedIn Study shows a clear inverse relationship between account size and growth potential. Small accounts (2K to 10K followers) are the fastest-growing segment on the platform. Meanwhile, “Big” accounts are seeing growth of barely 1%.
This suggests that users are looking for niche communities and fresh voices. Once a company becomes a “Big” brand, it often loses the personal touch that attracts new followers organically. For smaller businesses, this is a massive opportunity. You are in the “sweet spot” for growth.
The Demographics Data
So, how do you get more followers on LinkedIn? Well, first you need to understand the user base. Here are some key LinkedIn demographics stats to help give you more insight on exactly who you’re targeting on the platform.
- 30% of all US adults use LinkedIn.
- Almost half (47.3%) of LinkedIn users are between the ages of 25 and 34.
- C-level executives make up 10 million LinkedIn members.
- LinkedIn users are 56.9% male and 43.1% female.
- Just over 30% of LinkedIn desktop traffic comes from the United States.
- Over half (53%) of all US college graduates use LinkedIn. Including US adults with some college education, that number goes up to 81%.
- LinkedIn members have 2x the buying power compared to the average website audience.
- Millennials make up 40% of LinkedIn users.
- Nearly half (49%) of LinkedIn users make US$75,000 per year.
Mastering the Data with Metricool
Tracking these LinkedIn statistics manually is an impossible task for a busy professional. To truly understand how your specific brand fits into these global trends, you need a professional platform that simplifies the data.
- Monitor your LinkedIn company page stats in a single, grounded dashboard. Don’t just guess why your impressions dropped; use our platform to see the direct correlation between your posting frequency and your engagement rate.
- Our “Best Times to Post” feature is updated in real time based on your audience’s activity, allowing you to maximize the impact of every update.
- Turn raw numbers into a clear strategy. We help you move away from the frustration of the algorithm and toward a data-driven approach that respects your time and your goals.
LinkedIn Usage Statistics
- Every minute, 7 people find a job thanks to LinkedIn.
- 16.2% of LinkedIn users in the US open the app at least once per day.
- 40% of LinkedIn users organically engage with a page on the platform each week.
- LinkedIn members interact with pages on the platform over 2 billion times each month.
- 57% of active job seekers use LinkedIn, while 62% say they use Indeed.
- More than 1.7 million feed updates are viewed per minute.
- LinkedIn Premium subscribers increased 25% in 2024.
- There are an estimated 175 million+ LinkedIn Premium subscribers on the platform.
- LinkedIn Premium subscribers brought in US$1.7 billion to the company in 2025.
