X (Twitter) Stats 2026: Key Data for Marketers
 Gretchen Oestreicher
26 February 2026
Gretchen Oestreicher
26 February 2026 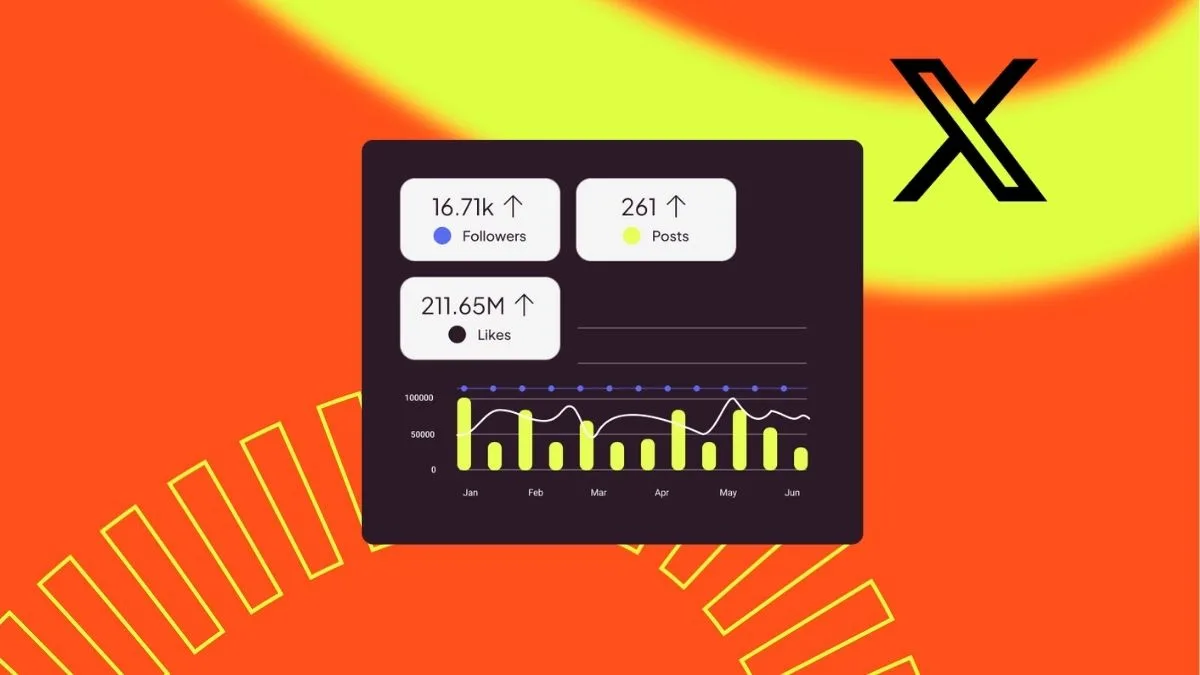
If you’ve been struggling to make an impact on X (formerly Twitter) since its rebranding, the data from that past year offers a clear map of where the attention is moving. Our 2026 Social Media Study provides an in-depth look at the shifting behaviors of users and the performance of brands connected. By analyzing these Twitter statistics, we can see that while reach is getting harder to achieve, you can make deeper connections than ever with your target audience.
Where Did We Get These X Statistics From?
Metricool is all about making social media marketing easier. We’re not content with just giving you the best tool for managing all of your networks; we also love providing key data that marketers can use to improve their social media strategy.
As part of our 2026 social media study, we analyzed 1,123,528 posts from 15,116 accounts on X. Here are the key statistics from our findings.
More Content, Focused Reach
The first set of x statistics we analyzed shows interesting shifts in how content is being produced and consumed. Creators and brands are working harder, but the algorithm is becoming more selective about who sees that work.
Overall Performance Comparison: 2024 vs. 2025
| Metric | 2024 | 2025 | Difference (%) |
| Weekly Posts | 15.97 | 17.34 | +8% |
| Impressions | 2,864.78 | 2,711.39 | -5% |
| Interactions | 37.83 | 42.71 | +12% |
| Engagement | 1.32 | 1.58 | +19% |
The Volume Surge: Why We Are Posting More
In 2025, the average number of weekly posts grew by 8%, moving from 15.97 to 17.34. This indicates that creators are finding more reasons to participate in the conversation. Whether it is through the resurgence of long-form Threads or the rapid-fire nature of live event commentary, the frequency of output is on the rise.
For marketers, this 8% jump suggests that the sweet spot for posting frequency is moving upward. To stay top-of-mind, brands are realizing that a single daily update is no longer enough to maintain a presence.
X Reach Statistics
Despite the increase in posts, total impressions saw a 5% decrease, falling to 2,711.39 per post. This is one of the most significant X/Twitter marketing stats for this year. It tells us that X is moving away from the “broadcast” model of the past.
The algorithm in 2026 is much more likely to show your content to a smaller, highly interested group of people than to a massive, disinterested crowd. This “Reach Recession” means that your total followers count is becoming less predictive of your actual reach. Instead, the quality of your first few hundred views determines the ultimate life of the post.
X Engagement Statistics
The most optimistic data point is the 19% increase in engagement. Even though impressions dropped, the engagement rate climbed from 1.32 to 1.58. This is proof that the users who do see your content are significantly more likely to do something with it.
The platform is shedding “passive scrollers” and retaining “active participants.” If your engagement is rising while your impressions are flat or slightly down, you are actually winning in the 2026 version of X. You are building a core audience that cares about your message.
The Interaction Breakdown
When we look closer at how users are interacting with posts, the story becomes even clearer. The “Like” button is still a staple, but it is no longer the primary engine of growth on the platform.
X Interaction Stats: 2024 vs. 2025
| Metric | 2024 | 2025 | Difference (%) |
| Interactions (Total) | 37.83 | 42.71 | +12% |
| Retweets (Reposts) | 4.93 | 6.67 | +35% |
| Replies | 2.10 | 2.56 | +21% |
| Likes | 30.25 | 32.89 | +8% |
| Profile Clicks | 8.29 | 5.68 | -31% |
Pass it on: The Retweet Revolution
The most explosive growth in our study is the 35% jump in Retweets. In 2024, the average post received 4.93 retweets; by 2025, that number hit 6.67.
This is a massive shift in user psychology. A Retweet is a much stronger endorsement than a Like. It says, “I want my own audience to see this.” This growth suggests that “viral loops” are the primary way content survives in 2026. If you want to succeed, you cannot just create content that people agree with; you must create content that they want to be associated with.
The Return of Replies
Replies have also seen a healthy 21% increase. This confirms that X has reclaimed its position as the center of digital discourse. Users are looking to argue, agree, and add nuance to the posts they see.
For brands, this means your “tone of voice” is more important than ever. If you post “corporate speak,” you will be ignored. If you post a controversial opinion or an open-ended question, you tap into that 21% growth in replies. The “Reply Guy” era has evolved into a legitimate community-building strategy.
X Likes Statistics
While Likes are up by 8%, they are growing at a much slower rate than Retweets or Replies. In 2026, a “Like” is seen as a low-effort interaction. It is the “social media nod.” While it is still the most common interaction (averaging 32.89 per post), it is no longer the metric that drives the algorithm’s “For You” feed as much as the more active Retweet or Reply.
The Missing Profile Clicks
Perhaps the most shocking of the Twitter statistics in this study is the 31% drop in profile clicks. In 2024, users were clicking through to a creator’s profile 8.29 times per post on average. In 2025, that plummeted to 5.68.
Why is this happening?
- In-Feed Consumption: The “For You” feed has become so efficient that users no longer feel the need to check a profile to see “what else this person has posted.” The algorithm simply serves up the next relevant post.
- The Death of the Bio: Users are making split-second decisions based on the content of the post itself, rather than the credentials in the bio.
- Link Penalization: X has historically penalized posts with external links. Users have adapted by staying within the thread or the feed, rarely venturing “out” to a profile or a website.
This -31% drop is a wake-up call for marketers who use X primarily as a traffic driver. If your goal is to get people to click your profile and then click your website link, you are fighting a losing battle. You must learn to convert your audience directly in the thread or through the conversation itself.
How to View Your X Statistics
X provides users with statistics via the X Business Center in the following ways:
- Monthly Report Card: See your highest performing posts and find influencers in your network.
- Post Activity Dashboard: Stats for every post, which you can export as a CSV file.
- Video Activity Dashboard: Key stats for all of the videos you post on the platform
- Ad Campaigns: Performance data for paid posts with conversion tracking.
Business Insights dashboard: Weekly rundowns of follower and engagement data.
Improve Your X Statistics with Metricool
Managing a presence on X in 2026 requires a level of precision that manual posting simply cannot provide. To capitalize on the 8% growth in posting frequency without burning out, you need a system that handles the heavy lifting for you. Here’s how Metricool can help you improve your X statistics:
Optimize for the Quote Tweet
Since Retweets are up 35%, your goal should be to provoke a reaction. The “Quote Tweet” is the ultimate form of interaction because it combines a share with a reply. Metricool allows you to cross-post content and reuse ideas that have sparked conversation on your other platforms. Avoid the middle ground. The algorithm rewards those who take a stand, even if it is a polarizing one.
Post for Impact, Not Frequency
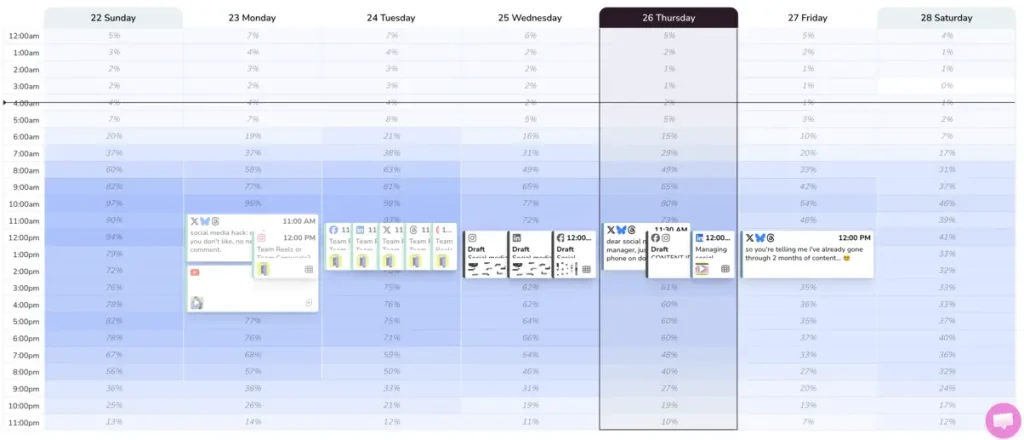
Instead of guessing why your impressions are down, you can use our “Best Times to Post” feature to ensure your content hits the feed when your specific audience is most likely to engage.
Focus on “Micro-Engagement” in Replies
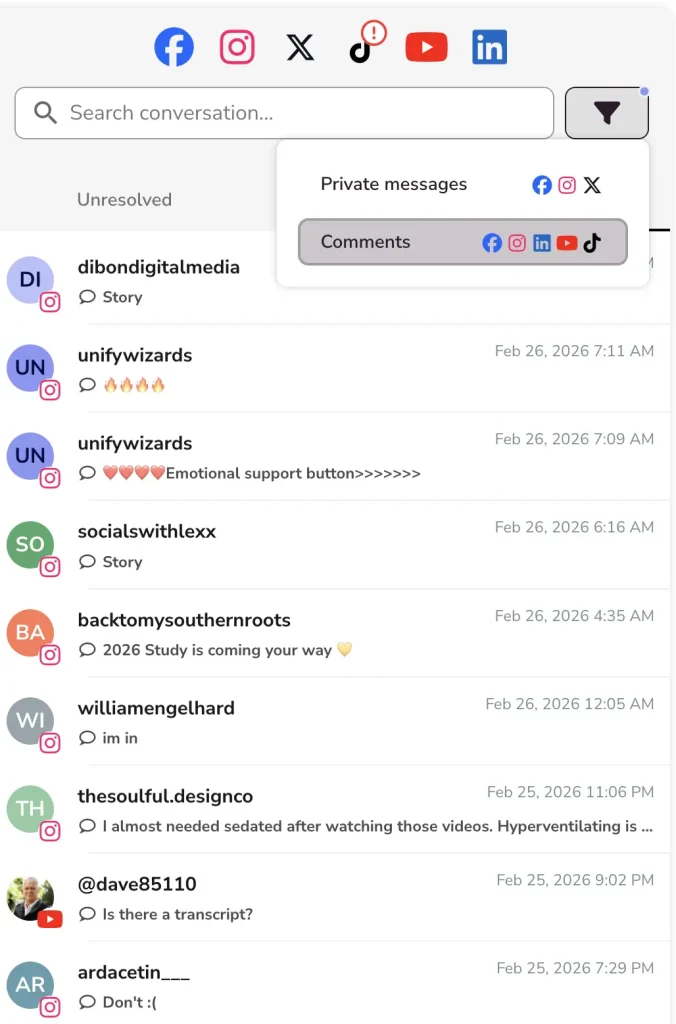
Since replies are up 21%, the “comments section” of your post is where the real marketing happens. Metricool helps you manage comments on all your platforms from one dashboard, so you can reply to potential clients immediately. This signals to the algorithm that the post is an “active conversation,” which can help reverse that 5% drop in impressions by pushing the post back into the feed.
The State of X in 2026
The Twitter statistics for 2026 paint a picture of a platform that has successfully transitioned from a “news wire” to a “social square.” It is smaller, louder, and much more interconnected than it was a few years ago.
The shift from 2024 to 2025 shows a community that is posting more (+8%), sharing more (+35%), and talking more (+21%). While the broad reach of the platform is tighter (-5% impressions), the value of the attention you do capture is significantly higher (+19% engagement).
To win on X this year, you must stop trying to reach everyone and start trying to move someone.
