Instagram Reel Analytics: Retention & Skip Rate Explained
 Kata
04 February 2026
Kata
04 February 2026 
If you’re a social media marketer or you create reels to promote your business, you know how important Instagram reel analytics are for your strategy — you need those stats to help your business grow. To make your insights even more precise, the platform keeps rolling out new metrics. The latest? Retention rate and skip rate for your reels.
What Are Instagram Reel Analytics?
Reel analytics give you a detailed look at how your audience interacts with your videos. Likes, comments, and shares are just the basics. With retention and skip rate, you can now see exactly where viewers drop off and how to optimize your content for better engagement.
Reels Insights: New Charts
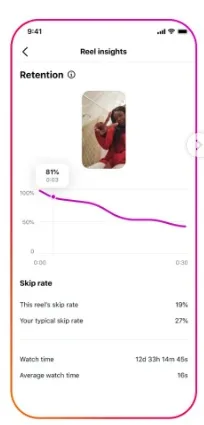
A retention chart in your reels’ insights gives you a visual breakdown of how engaged your audience has been over time. This interactive chart shows exactly when viewers leave, helping you tweak your videos.
In addition, Instagram will soon replace the old view rate metric with skip rate, which shows how many viewers leave within the first 3 seconds. Together, these tools make it easier to:
- Identify the best hooks
- Keep viewers engaged until the end of your video
- Spot which content resonates with your audience
Looking for inspiration for viral hooks? Find some in our article below:
What Are Retention and Skip Rates?
The retention rate shows how long your reels are actually watched. You can track exactly when viewers drop off through a visual, downward trend in the retention chart. The horizontal axis is video duration (seconds) and the vertical axis is retention percentage (starts at 100% at second 1, then slopes down).
Skip rate indicates the percentage of viewers who decided to skip your reel and scroll past within the first 3 seconds. It replaces the earlier view-rate metric, which only measured how many people watched those first 3 seconds.
Together, these two new metrics make it easy to see which videos hit the mark — and which might need a little tweak.
What is a Good Skip Rate on Instagram?
That’s the million-dollar question for many creators out there. Since there is no official Instagram source (so far) on what percentage equals good performance versus room for improvement, here’s what’s for sure a good indicator:
- If most viewers are skipping (high skip rate) = Bad: People are leaving before your message even starts.
- If about half are skipping (medium skip rate) = Average: Your hook works sometimes, but not consistently.
- If few viewers are skipping (medium-low skip rate) = Strong: Your video is holding attention.
- If very few are skipping (low skip rate) = Brilliant : You nailed the hook and people are watching and sharing a lot.
Keep in mind: The lower the skip rate, the better.
What is a Good Retention Rate?
While skip rate focuses on the first 3 seconds, retention rate shows how long viewers actually stay.
The higher the retention rate, the better. Here’s what to look for in your retention curve:
- Sharp drop early on = Weak hook: People are leaving fast.
- Steady decline throughout = Average: You’re keeping some viewers but losing momentum.
- Holds strong through most of the video = Strong: Your content keeps attention well.
- High retention until the end = Excellent: People are watching almost the entire reel.
The 3-Second Rule is Real
The first 3 seconds of your Reel are make-or-break. This is where most viewers decide whether to keep watching or scroll past; and the data proves it.
Instead of focusing on arbitrary benchmarks, pay attention to where your audience drops off by looking at your retention curve in Metricool’s analytics.
- Does it dip sharply in the first few seconds? That’s your hook.
- Does it flatten in the middle? Your content might be dragging.
- A drop near the end? You’re losing people before your CTA.
Analyze Reels Retention in Metricool
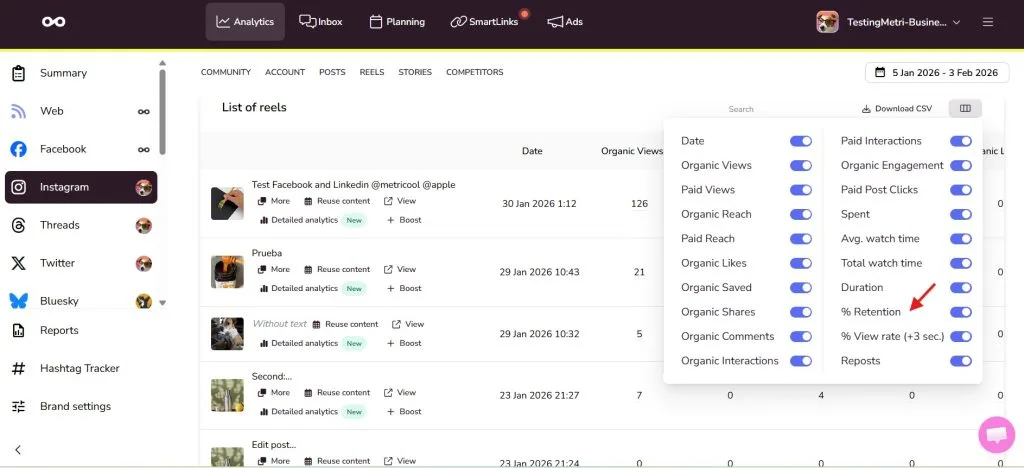
Metricool makes Instagram performance analysis easier by letting you track retention across all your reels in one place.
To wrap things up, retention rate shows you exactly when viewers dropped off during your reel, so you can identify the precise moments where your content loses momentum, whether it’s a weak opening hook, a slow middle section, or a conclusion that doesn’t deliver. Then you can test changes (different hooks, tighter editing, stronger CTAs) and track how your retention curve improves over time.
The goal isn’t to hit a specific percentage but to understand your audience’s behavior and adjust accordingly.
Want to give it a try? Sign up for free and test it for yourself.
