Boost Engagement & Growth: The Power of Metricool’s Instagram Analytics Tool
 Gretchen Oestreicher
24 June 2026
Gretchen Oestreicher
24 June 2026 
Instagram is still one of the biggest places your audience hangs out, and the work on your end is heavier than ever. Views are up 27%, interactions are up 19%, and brands are publishing 24% more than they did last year. That’s a lot of effort going out the door, and the question is whether you can tell what’s actually working.
That’s where Instagram analytics come in. They show you which posts your audience saved, which Reels they finished, what time they were online, and how your follower count is changing over time. Metricool’s Instagram Analytics tool pulls all of that into one view, so your next post is informed by real numbers instead of general best practices.
Why Instagram Analytics Matter
Without analytics, you’re guessing. The wins feel like luck, the flops feel like a mystery, and there’s no way to plan around either.
This matters more this year than last. Views on Instagram rose 27%, but engagement rate dropped about 6.6%. More people are seeing your content, fewer are interacting with it, and analytics are how you tell which posts are getting seen versus which ones are landing.
The rest of this article walks through what Metricool tracks, what each metric actually means, and how to use the data to make better decisions for your next post.
Community Analytics: Where Your Growth Is Coming From
Building a community on Instagram takes time, and the numbers behind it tell you whether you’re heading in the right direction. Metricool’s Community Analytics covers four data points that explain how your audience is changing.
Follower Growth
This tracks your total follower count over time, and the shape of the line matters as much as the number at the end.
- A clean upward slope usually means your content is being recommended consistently to people who match your existing audience.
- A spike followed by a drop within 48 hours often means a post reached people outside your niche who followed in the moment but didn’t stick around.
- A flat line with steady posting is a signal that you’re reaching your existing audience but Instagram isn’t pushing your content to new accounts. Time to test a new format or topic.
- A sudden drop with no obvious cause is often a bot purge, which Instagram runs periodically. Wait a week before treating it as a real change.
When you spot a spike, click into the post that caused it. That’s the content type, hook, or topic Instagram and your audience both responded to, and worth doubling down on.
Following Count
Less discussed than follower count, but useful. A bloated following count (where you follow far more accounts than follow you) makes your profile look less established to new visitors. Metricool shows you the trend over time, so if you’ve been follow-back farming or accumulating accounts you forgot about, you can see it and tidy up.
Content Volume
This is how much you’re publishing across feed posts, Reels, and Stories combined. There’s no single right number, but the data suggests a curve:
- Smaller accounts (under 100k followers) tend to peak around 7 to 14 posts a week.
- Larger accounts (over 100k followers) often do better posting less.
Watch how your output lines up with your engagement rate, not just your views. If you’re posting more and engagement is dropping, you’re probably stretching thin and your audience is feeling it.
Follower Balance
This is the one most people miss. The Balance shows the daily net difference between followers gained and lost, so a day where 50 people followed and 30 unfollowed shows up as +20.
What to look for:
- Days with high gains AND high losses often line up with content that polarized people. Worth checking whether that polarization is bringing in your kind of audience or chasing them away.
- A pattern of small daily losses with no gains usually points to content fatigue. Your existing audience isn’t disappearing, but no new people are finding you.
- A clear loss after a specific post is data, not failure. Click into the post and see what changed.
Worth knowing: Instagram only provides follower data for Business or Creator accounts with at least 100 followers, so newer accounts won’t see numbers here yet.
Growth happens fastest when you’re under 10,000 followers, and across every platform in 2026, only TikTok beats Instagram for moving accounts up a tier. Small, informed adjustments add up quickly here.
Demographics: Who’s on the Other Side of the Screen
A follower count tells you how many people are listening. Demographics tell you who they are, which is what shapes your content decisions. Metricool breaks your audience down three ways.
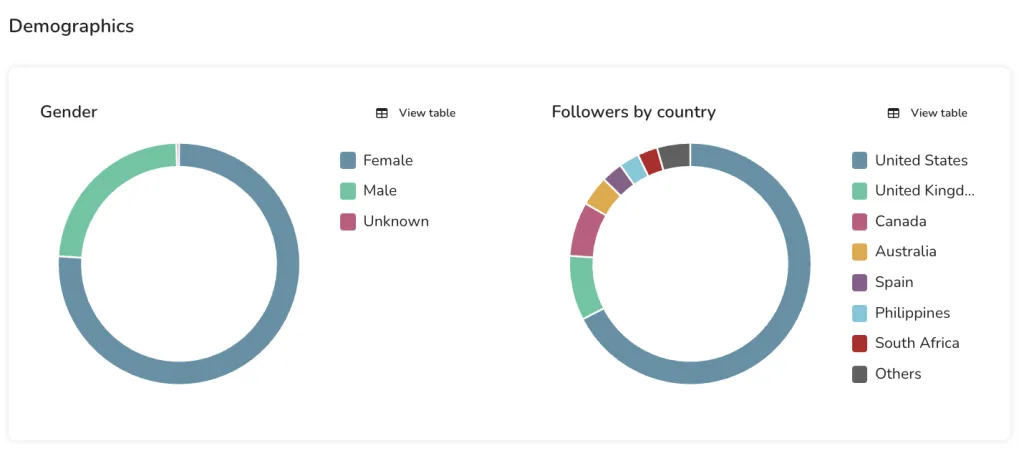
Gender Distribution
Useful for two things: confirming your content is reaching the audience you intended, and spotting a mismatch you can act on. If you’re selling products to women but 60% of your followers are men, your messaging might be off, or you might be attracting an audience that engages but doesn’t convert.
Age Groups
Metricool shows you where your followers fall, from 13 to 17 up to 65+. This affects tone, references, and the platforms your audience cross-uses.
- A 25 to 34 skew means you can lean into work-life references, professional pain points, and slightly more polished content.
- A 18 to 24 skew means trends move faster, audio matters more, and overly produced content can feel out of place.
- A 45+ skew usually means longer captions perform better and explanatory content beats fast-paced edits.
Geographic Data
Two practical uses:
- Posting times. If half your audience is in another time zone, your “best time to post” is a compromise, not a single answer.
- Language and references. A creator with a UK audience writing in American spellings, or vice versa, sees engagement leak quietly over time.
One thing to note: demographics always reflect the current state of your audience, regardless of which date range you have selected. There’s no historical view here.
If your content is built for one audience and your followers turn out to be a different one, no amount of posting fixes that. This is where you find out.
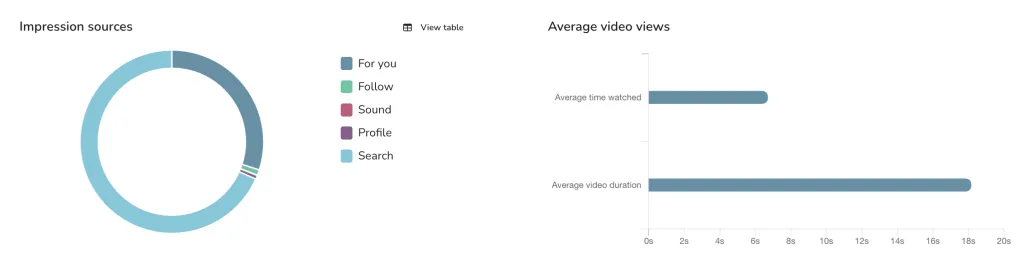
Account Overview: Your Profile at a Glance
Before going deep into any one post, your Account Overview gives you the high-level read on how your profile is performing.
- Views: Total views generated across your posts, Reels, Stories, profile visits, and user searches. This replaced impressions across Instagram in April 2025. Account views are your widest visibility metric. They include every time someone interacted with anything connected to your account.
- Average Reach: The number of unique accounts you reach each day. Reach grows when Instagram pushes you to new people. Views grow when content is shown repeatedly, including replays. Comparing the two tells you whether your audience is expanding or just engaging more deeply with the existing one.
- Interactions: Total likes, comments, shares, and saves across all your content in the period. Look at this alongside views: if views go up but interactions stay flat, your content is getting seen but not landing.
- Profile Activity: Aggregated profile-level engagement data straight from the Instagram API. A good directional read on whether your profile is doing its job as a destination, not just a stop along the scroll.
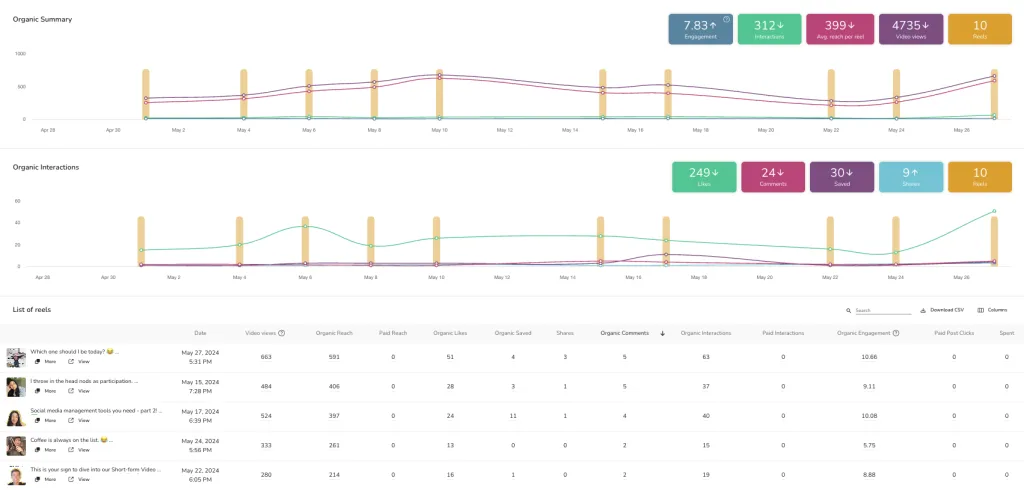
Post Performance: What’s Working and What Isn’t
This is the section where you find out which content was worth the time it took to make. Metricool’s Post Performance breaks it down across engagement, reach, content type, and hashtags.
Organic Metrics
- Engagement Rate: How well your audience interacts with your posts, calculated from organic data only (even if you have Meta Ads connected). General benchmarks: 1 to 3% is solid for accounts under 100k, 0.5 to 1% is typical for larger accounts. Industry matters too, so the most useful comparison is against your own baseline, not against an industry average.
- Interactions: Likes, comments, shares, and saves. Saves and shares carry more weight now, since Instagram treats both as a signal that the content is worth showing to more people.
- Reach: Average organic reach per post.
- Views: How often your posts are seen, including repeats.
You can break views down by origin, so you see what came in organically versus what came from a boost. Promoted data needs a connected Meta Ads account.
How to Read Interaction Data
Each interaction type tells you something different:
- Likes are the lightest signal. Useful for trend-spotting but not much else.
- Comments show your content sparked enough reaction for someone to type. If you’re asking questions in captions and getting no comments, the prompt isn’t landing.
- Saves mean “I want this later.” Strong signal for educational, how-to, and reference content.
- Shares mean “others need this.” This is the strongest distribution signal Instagram looks at, because shares move your content outside your existing audience.
A post with high saves but low shares delivers personal value. A post with high shares but low saves delivers social currency. The content that grows accounts tends to deliver both.
Content Breakdown
Compare image posts against carousels. The gap between them is bigger than it used to be. Carousels beat single images on every metric, with double the reach and views and around 9x more saves, and single-image posts have lost ground, especially for larger accounts.
Why carousels work: each slide is another chance to grab attention. Instagram also re-shows carousels in feed to people who didn’t swipe past the first slide, which is part of why the reach numbers run so high. If your first slide hooks and your second delivers, the rest of the swipes do a lot of the heavy lifting for you.
Reels are tracked separately, in their own analytics section, since they behave differently from feed posts.
Hashtag Performance
Hashtags don’t do what they used to. Posts that use them tend to get 31% fewer views, though that’s a correlation rather than proof they cause the drop. Instagram removed the option to follow hashtags in late 2024 and capped posts at five hashtags by late 2025. At the same time, caption and keyword SEO matters more, since public posts now appear in Google and Bing.
Metricool’s hashtag analytics cover Feed posts only (Reels hashtags aren’t included in this view). For each tag you’ve used, you can see:
- The views each post brought in, averaged if the tag was used multiple times.
- How many of your posts include it.
- The likes and comments those posts earned.
How to use this: sort by views and look for the tags that consistently bring in numbers above your average. Drop the ones that underperform. Don’t stack five hashtags out of habit. Three relevant tags will do more work than five generic ones, and your caption keywords will do more for discoverability than either.
Instagram Reels: The Format the Algorithm Still Loves
Reels are the only Instagram format whose engagement rate is still growing. The average Reel earns over four times the interactions of a single-image post, shares are up 67%, and average watch time more than doubled, from 4 to 8.5 seconds. If they’re not in your content plan, that’s where to start.
Metricool’s Reels Analytics goes past views and likes:
- Performance Summary: Engagement rate, average reach, views (replays included since April 2025), and average watch time.
- Interactions: Likes, comments, saves, shares, and reposts.
- Retention Rate: What percentage of the Reel’s total duration your viewers watched on average, calculated as average watch time divided by Reel duration.
- View Rate (3-second): The percentage of viewers who watched past the first 3 seconds, which is the threshold Instagram uses to decide whether to keep pushing your Reel.
How to Read Reels Data
The two numbers that matter most are view rate and retention. Together they tell you whether your hook works and whether your content keeps people watching.
- View rate under 40% means your hook is weak. Most viewers swipe before 3 seconds, and Instagram won’t push the Reel to anyone new.
- View rate over 80% means your hook is doing its job. Now the question is whether retention holds up.
- Retention under 50% means people are starting your Reel but not finishing it. Your hook is fine, your middle is losing them.
- Retention over 100% is possible, and it’s the strongest signal you can get. It means viewers are rewatching, which Instagram reads as a clear sign to recommend the Reel further.
Reposts are the other quiet signal worth watching. A repost means a creator or account saw your content and wanted it on their own profile. That’s almost always followed by a reach lift on the original.
Longer Reels with high retention beat short Reels with mediocre retention. If your retention rate holds steady at 60 to 90 seconds, you can keep pushing length. If it drops sharply after 15 seconds, shorter is the move.
Instagram Stories: The Conversation Channel
Stories shifted purpose this year. Replies have nearly doubled and people are leaving them less often, so Stories work more as a direct connection channel now than a reach play. Metricool tracks them two ways:
- Evolution: A period-level overview with impressions and average reach per story.
- Stories List: Performance for each individual Story, including impressions, organic reach, replies, taps back, taps forward, and exits.
How to Read Stories Data
Each tap pattern tells you something different:
- Taps forward mean a viewer skipped to the next story. Some skipping is normal (a typical Stories session moves fast), but high tap-forward rates on specific stories signal that something about that frame isn’t pulling them in.
- Taps back mean a viewer wanted to re-read or re-watch. This is usually a positive signal: text was too small, the moment was funny, or the information mattered enough to revisit.
- Exits are the negative signal. The viewer didn’t go to the next story, they left Stories entirely. A high exit rate on a specific frame is worth investigating.
- Replies are the strongest engagement signal Stories offer. They open a DM thread, which is where most relationship-building on Instagram now happens. A Story that gets fewer impressions but more replies is often more valuable than one with the opposite pattern.
If you’re using Stories for awareness, watch impressions and reach. If you’re using them for community, watch replies and taps back.
Competitor Analysis: What the Rest of Your Niche Is Doing
Watching your own numbers tells you half the story. The other half is what’s working for accounts your audience also follows. Metricool’s Competitor Analysis compares your performance against accounts in your niche on:
- Follower count
- Number of posts and Reels
- Likes and comments
- Engagement rate
How to Read Competitor Data
The mistake people make is comparing follower counts. Follower count tells you who got started earlier. Engagement rate and posting frequency tell you who’s working harder right now.
- Higher engagement rate than yours, with similar posting volume: their hooks and topics are landing better. Audit their top 5 posts and find what they have in common.
- Similar engagement rate, but posting twice as often: they’re getting twice the total interactions even if each post performs the same. Worth deciding whether your audience can handle higher volume from you.
- Lower engagement rate, higher follower count: they grew fast, the audience didn’t stick, and their content is now reaching a passive audience. Don’t model their playbook.
Here’s what to do with that data:
- Identify Content Gaps: Look at the topics and formats your competitors cover well, and the ones they skip. Use that to create content that fills the gaps.
- Study Visual and Messaging Trends: Watch for patterns in their best posts (recurring design elements, color schemes, messaging). Borrow the idea, keep your identity.
- Track Campaign Effectiveness: See how competitors run campaigns, promotions, and collaborations. Look at timing, frequency, and content.
- Watch Competitor Hashtags: See which hashtags competitors use and how they perform. Fewer, well-chosen tags tend to work better now.
- Analyze Audience Preferences: Their engagement metrics show what your shared audience values.
Competitor engagement is calculated differently from your own account, since Metricool can only see public data for competitors. Add your own account as a competitor to get a directly comparable number.
More Analytics Features Worth Knowing About
If you’re managing several accounts, a team, or multiple campaigns, a few extras change how the day-to-day goes:
- Custom Date Ranges: Focus on the metrics that matter for a specific time frame, whether that’s a campaign window, a month-over-month read, or a same-week comparison year over year.
- Data Filtering and Sorting: Sort and filter your data to surface trends faster, especially useful when you have hundreds of posts and need to find your top performers by save rate or reach.
- Visualization Tools: Switch between tables and charts to read your data the way you prefer. Charts work better for spotting trends, tables work better for direct comparisons.
- Automatic Reporting: Build custom reports and send them to clients, stakeholders, or your team automatically, so you stop rebuilding the same slides every month.
Reporting: Turn Data into Decisions
Metricool offers three reporting options for Instagram, each suited to a different need:
Standard Reports: automated monthly reporting
Generate fully customizable Instagram reports combining community growth, post performance, Stories, Reels, and competitor data in a single document. Configure your report with:
- Period: month-by-month analysis compared to the previous period
- Language: choose from over 10 languages
- Template: use a saved template or build your own (Advanced and Custom plans)
- Sections: choose which metrics to include
- Logo: add your brand or client’s logo
- Format: download in PDF or PPT
- Automatic delivery: schedule monthly reports to land in your (or your client’s) inbox automatically
Campaign Dashboards: see the full picture of a campaign
Running an Instagram campaign alongside content or ads on other platforms? Campaign Dashboards let you group all related content together, including organic posts, Stories, Reels, paid ads, and analyze everything in one place. Tag content to a campaign while scheduling and Metricool pulls the combined results automatically, with AI support to help you interpret what worked.
Particularly useful for product launches, seasonal campaigns, or influencer activations – any time you need cross-platform performance presented clearly and quickly.
Campaign Dashboards are currently available as a free add-on, with plans to become a paid feature for Starter and Advanced plans.
Metricool Studio: AI-powered Instagram reports
Skip the manual setup entirely. With Metricool Studio, you describe what you want to know and the tool finds it in your data, builds the visuals, and gives you clear next steps. For Instagram specifically, you could ask:
- “Which of my Instagram posts drove the most engagement last month?”
- “What’s the best time to post based on my own audience data?”
- “Compare my Reels performance with my carousel performance this quarter.”
- “How has my follower growth changed since I started posting more consistently?”
Reports from Metricool Studio are shareable via a public link (no login needed for whoever receives them) and update automatically, so there’s no rebuilding from scratch every month.
Metricool Studio is currently available as a free add-on, with plans to become a paid feature for Starter and Advanced plans.
What Else You Get With Metricool
Analytics are one part of Metricool. The rest of the platform is built to take work off your plate:
- Plan Content Ahead: Schedule as far ahead as you need with the content planner. Share previews with colleagues or clients and gather feedback before anything goes live.
- Post at the Right Time: Get daily data on when your followers are most active. Across the platform, 7 to 9 p.m. tends to draw the most people any day of the week, but your own follower data is what to act on.
- Cut the Repetitive Work: Tools like the AI Assistant and Instagram Hashtag Generator take some of the load off, and you can use them on a free account.
Start Tracking Instagram Analytics with Metricool
Instagram changes fast, and the work of running an account doesn’t get any simpler. Formats shift, metrics get deprecated, algorithm priorities move around, and through all of it you’re still expected to publish, engage, and grow.
Analytics are the part that keeps you grounded. They show you which posts your audience actually responded to, which Reels held attention, which Stories started conversations, and where your community is heading. Once you know what to look for, the patterns are easier to read than they seem.
Metricool combines powerful analytics, intuitive tools, and seamless automation to help you unlock your Instagram account’s full potential. From tracking community growth to competitor benchmarking and personalized reporting, Metricool offers everything you need to make data-driven decisions that amplify your social media impact.
Start using Metricool today to turn insights into action and achieve measurable results for your Instagram strategy. Whether you’re building your audience, increasing engagement, or optimizing campaigns, Metricool is your ultimate Instagram analytics partner.
See What’s Actually Working on Your Instagram
Metricool’s analytics show you the patterns behind your posts, Reels, and Stories so you can focus on the content your audience responds to.
