LinkedIn Analytics to Measure Social Success
 Alexis Turner
27 March 2025
Alexis Turner
27 March 2025 
LinkedIn is one of the most robust social media platforms, connecting professionals with industry leaders and helping them find new career opportunities. Brands leverage this platform to gain authority, build a community, and win clients. Understanding your LinkedIn analytics will reveal your social success and help you flourish on this network.
In this post, I will explain the most important LinkedIn analytics to measure and tools to seamlessly automate your data and lead you in the right direction.
Understanding LinkedIn Analytics
Did you know that marketing on LinkedIn can generate 2x higher conversion rates? This platform is unique due to its high professionalism and qualified users. It is now more than an employment site, but a complete social media platform that allows you to cultivate authentic audiences, share valuable resources, entertain an audience, and network with other professionals.
Why Analyze LinkedIn Performance?
Your analytics dashboard is packed with insights that can seriously boost your presence. Here’s why you should care about those numbers:
• Get smart about growing your network by understanding exactly who’s engaging with your stuff
• Track your paid campaigns to see where your money’s making the biggest impact – from views to conversions
• See which content gets people talking with engagement stats – use this to create more of what works and less of what doesn’t
• Keep an eye on what’s working for your competitors and use those insights to improve your own strategy
• Shape your professional brand based on actual data instead of guesswork, making sure you’re hitting the right notes with your target audience
Learning who your audience is, what they are looking for, and how to best engage them lies in the data. Through demographic, performance, and growth metrics, these answers uncover themselves. So, what are the most important LinkedIn analytics?
Let’s break the metrics into four categories –– audience, content performance, growth, and competitor metrics. Depending on your goals, you can measure the metrics that measure these goals.
LinkedIn demographic metrics
These metrics define who your audience is and how to target them. Within LinkedIn, you can view your demographic analytics in your profile dashboard. If you are a page admin, you can select “View as admin” to see a breakdown of your analytics.
When analyzing your page, select a custom date range of up to one year.
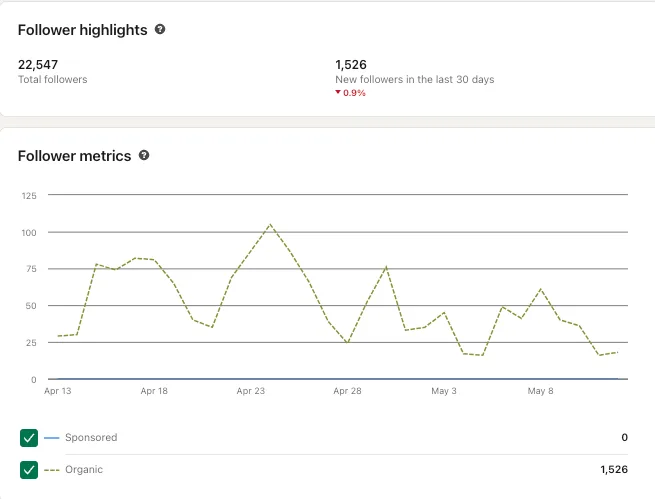
By clicking the “Followers” tab, you can see an evolutionary graph of your total followers and new followers over the last 30 days.
Below, view your follower demographics by the following filters:
- Job function
- Company size
- Industry
- Location
- Seniority
This information will help you create more valuable content for your niche audience. With this data, you can understand the job positions, industries, and cities they live in.
You can view your followers at the bottom of the page to connect with them and better understand what they seek.
LinkedIn Visitor Analytics
Have you ever wondered who’s checking out your LinkedIn company page, even if they’re not following you? That’s where visitor analytics come in handy! It’s like having a behind-the-scenes peek at who’s interested in your content and what makes them tick.
- Who’s stopping by? Track your page views and unique visitors to see how many people are actually landing on your page (and coming back for more!)
- The scoop on your audience: Find out what kind of folks are interested in your content – super helpful for knowing who you’re really talking to
- Engagement detective work: See what content gets people clicking and interacting – because let’s face it, that’s what we’re all after
- Phone vs computer browsing: Know how your audience likes to scroll through your content, so you can make sure it looks awesome no matter what device they’re using
- Think of it as your secret weapon for creating content that actually resonates with your audience. The more you know about who’s checking you out, the better you can tailor your content to keep them coming back for more!
LinkedIn content performance metrics
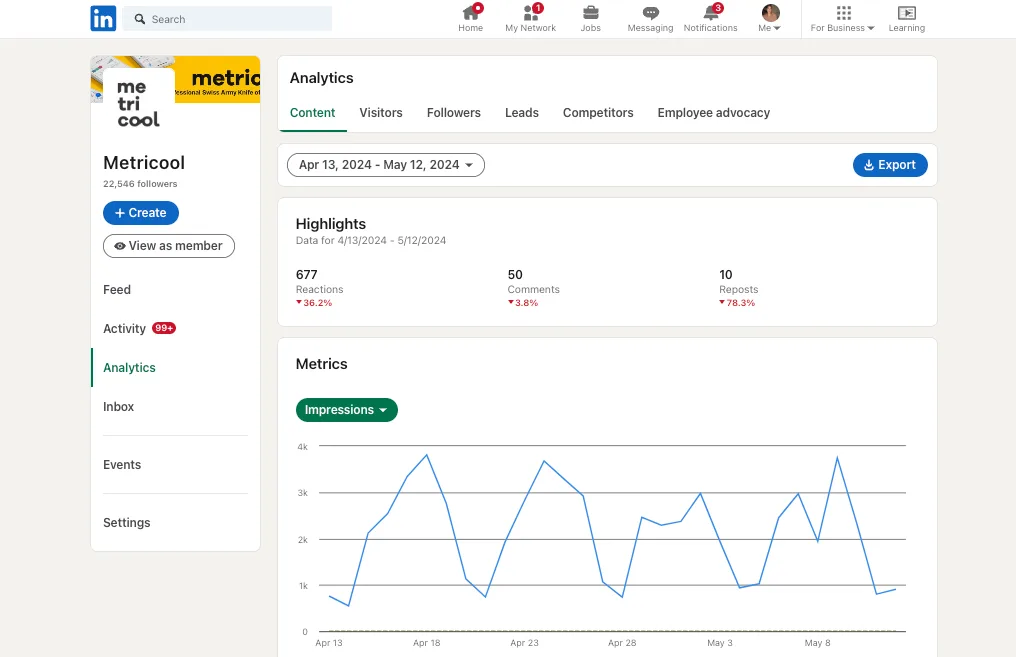
When viewing how your content has performed, you will see a graph showing the evolution of the selected metric. At the top of this page, view your overall performance highlights – reactions, comments, and reposts.
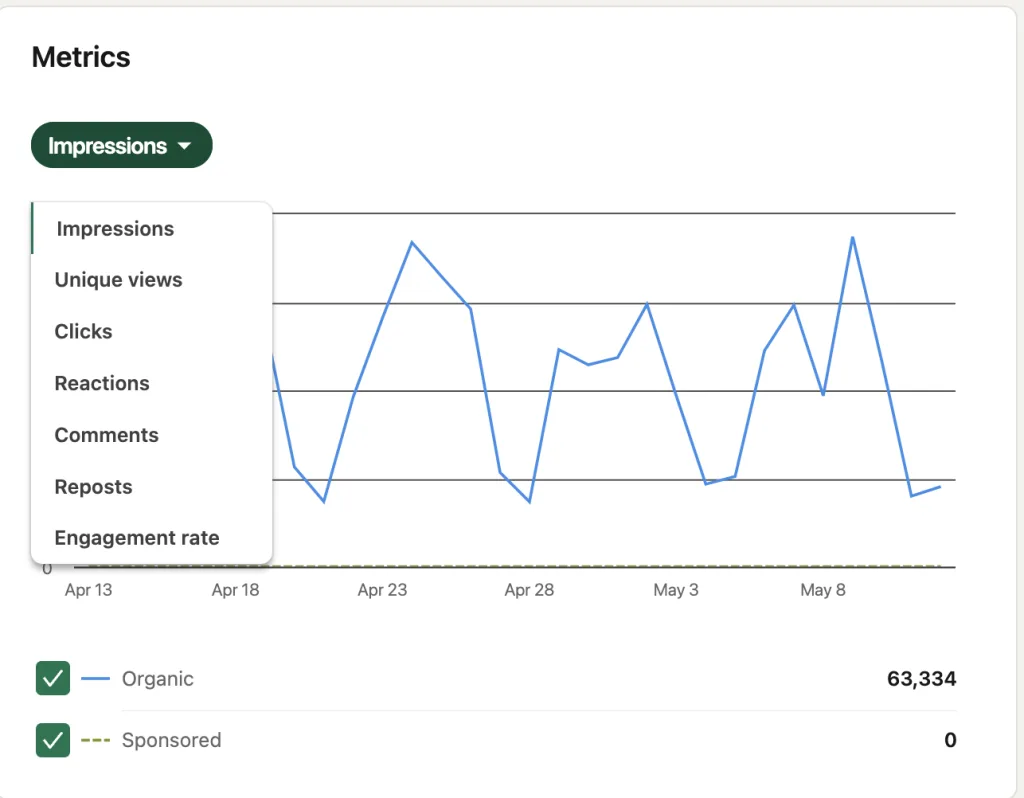
You can also measure per the following metrics:
- Impressions
- Unique views
- Clicks
- Reactions
- Comments
- Reposts
- Engagement rate
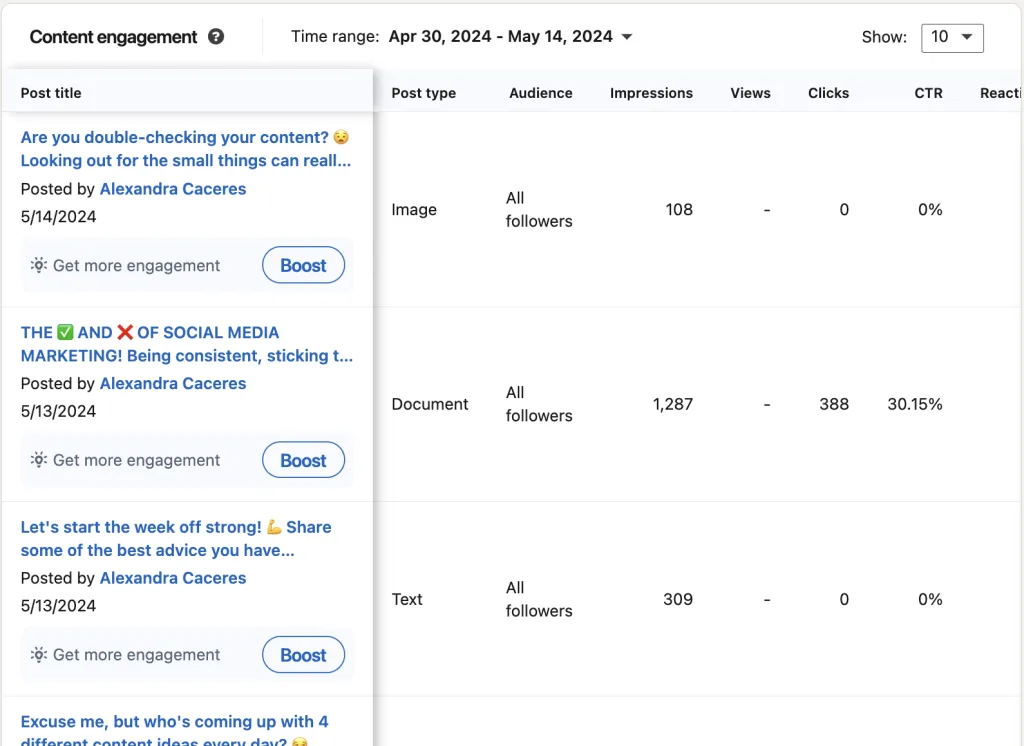
Below this graph, you will see a Content engagement section, with a breakdown of your top-performing posts. This shows:
- Post type
- Audience
- Impressions
- Views
- Clicks
- CTR
- Reactions
- Comments
- Reposts
- Follows
- Engagement rate
LinkedIn page growth metrics
By clicking on the “Visitors” tab, you can see an evolutionary graph of your page views, unique visitors, and custom button clicks. When viewing the graphs, filter by the page views or unique visitors, and then select the page – Home, About, Insights, and People.
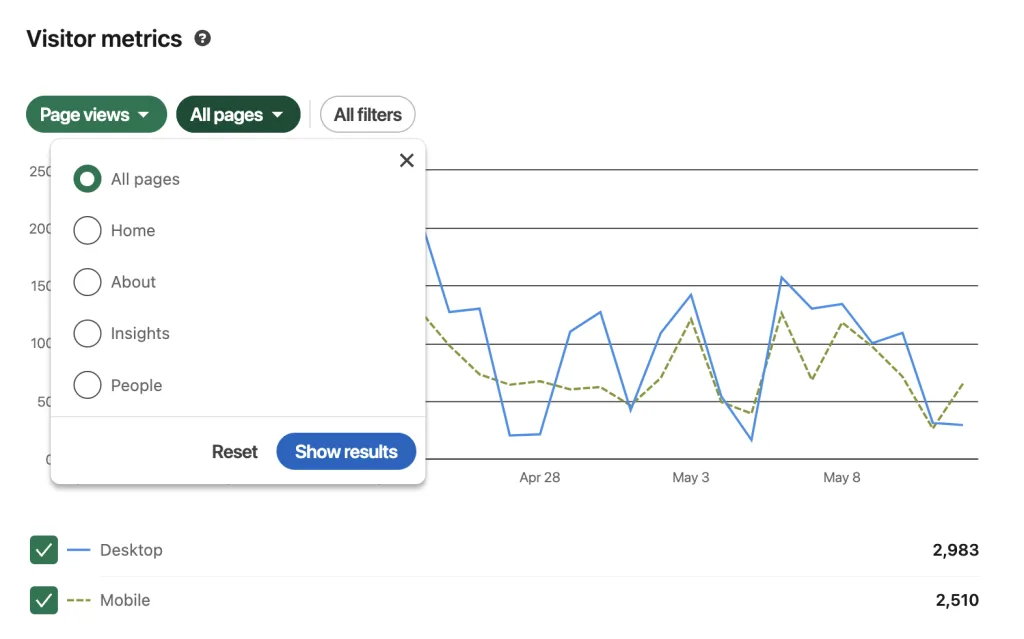
As you can see in the graph, you can view results for both desktop and mobile versions. In this tab alone, you have powerful information about which pages are gaining the most visibility and how many people view your page.
Below, view your visitor demographics by the following filters:
- Impressions
- Unique views
- Clicks
- Reactions
- Comments
- Reposts
- Engagement rate
LinkedIn competitor metrics
Lastly, on LinkedIn, you can view your main competitors’ performance. View your competitor’s new follower count, engagement rate evolution, number of posts published, and trending competitor posts per the period.
Underneath the number figures, you will see the change percentage and a green or red arrow indicating a growth or decline.
How to Use LinkedIn Analytics to Measure Success
As you build your LinkedIn marketing strategy, keeping your main objectives and goals at the forefront will help you stay focused and allow you to measure growth accurately. Then, you can use the above metrics to see if you are meeting these goals.
You can create monthly social media reports to keep track of your monthly evolution and share this with your team or client. Then, depending on your numbers you can tweak your content marketing strategy
LinkedIn Analytics Tool: Metricool
If you manage multiple social media platforms, you know the pain of jumping between platforms to post content, answer your comments and DMs, engage with other users, and grow your brand’s awareness.
However, with a comprehensive social media management tool like Metricool, you can manage all your social media profiles in one place. Schedule and auto-publish content, view follower and page analytics and view all comments and messages – with the same tool.
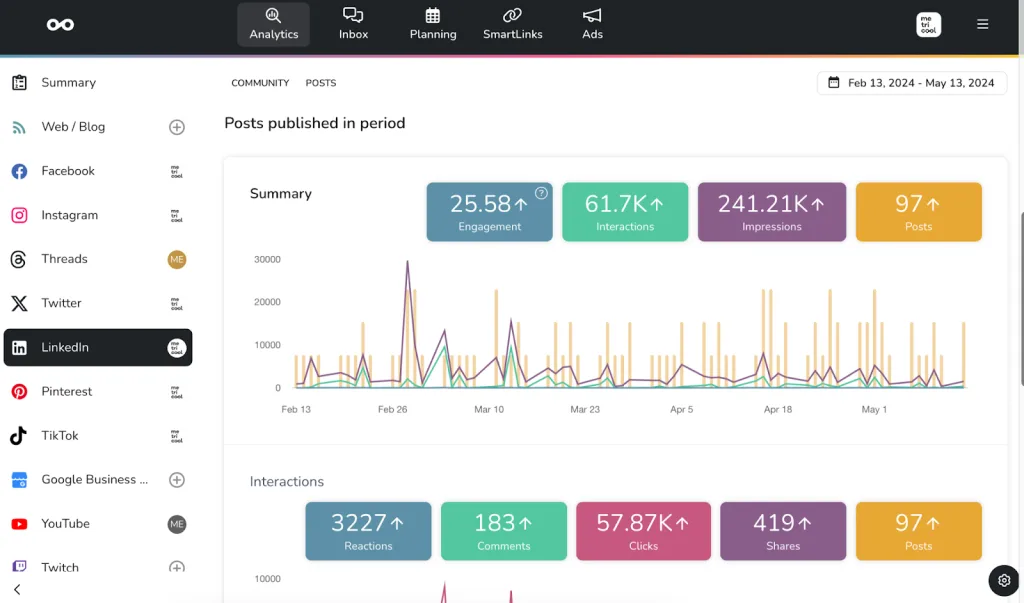
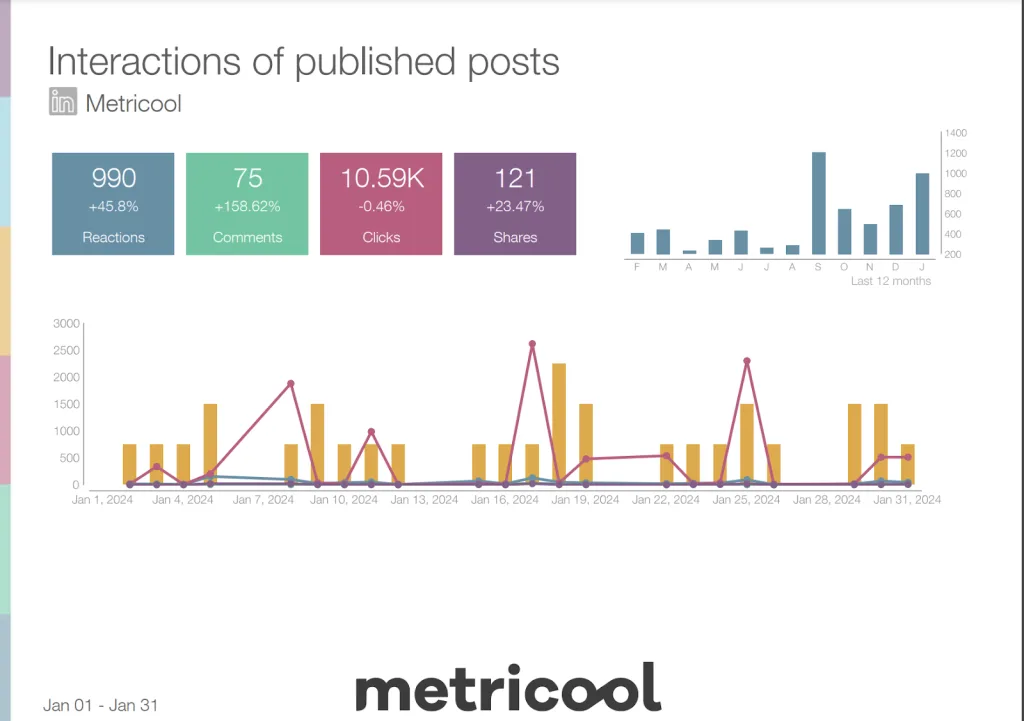
When connecting your LinkedIn page with Metricool, you can see your community growth, content performance, interactions, and a list of your top-performing posts. The tool displays easy-to-read graphs, allowing all expertise levels to understand these analytics.
⚠️To create custom LinkedIn reports on Metricool, you must have a Premium plan – Starter, Advanced, or Custom. For the latter two, you can create custom templates to save for other reports.
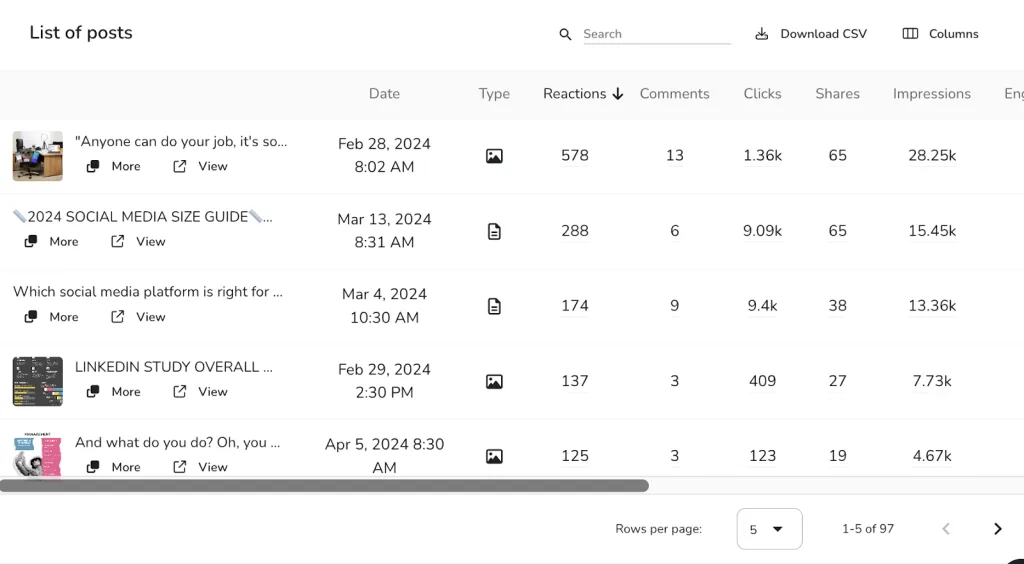
The list of posts breaks down the individual metrics of your top posts showing the post type, reactions, comments, clicks, shares, impressions, engagement, video views, viewers, time watched, and average watch time.
Analyzing this data will improve your content marketing strategy, as you start to see patterns of what works well with your audience.
LinkedIn analytics reports
As mentioned above, creating social media reports on LinkedIn allows you to track your monthly data in a cohesive document. Manually reporting this data is time-consuming, so that’s why at Metricool we have created an automatic reporting feature. This allows you to create comprehensive, visually appealing social reports without spending hours.
Select the period, language, and social networks for your report. Then select the metrics you want to organize the report by and add your brand logo. For Advanced and Custom accounts, you can customize your template by adding cover and body backgrounds, and brand colors. Then, view a preview of your report before downloading.
Then, generate the report in PDF or PPT!
Below the customization, you can also automate monthly reports to send to your client or coworker on the same day each month. Metricool works to do the heavy lifting so you can work on your strategies, creatives, and campaigns.
Metricool is completely free, however, if you want to connect your LinkedIn account, you must have a Premium account. We aim to keep costs low, so you can focus on growing your business. Create your account and see what centralized social media management can do for you:
