

How to Create Custom LinkedIn Analytics Reports
 Anniston Ward
28 May 2026
Anniston Ward
28 May 2026 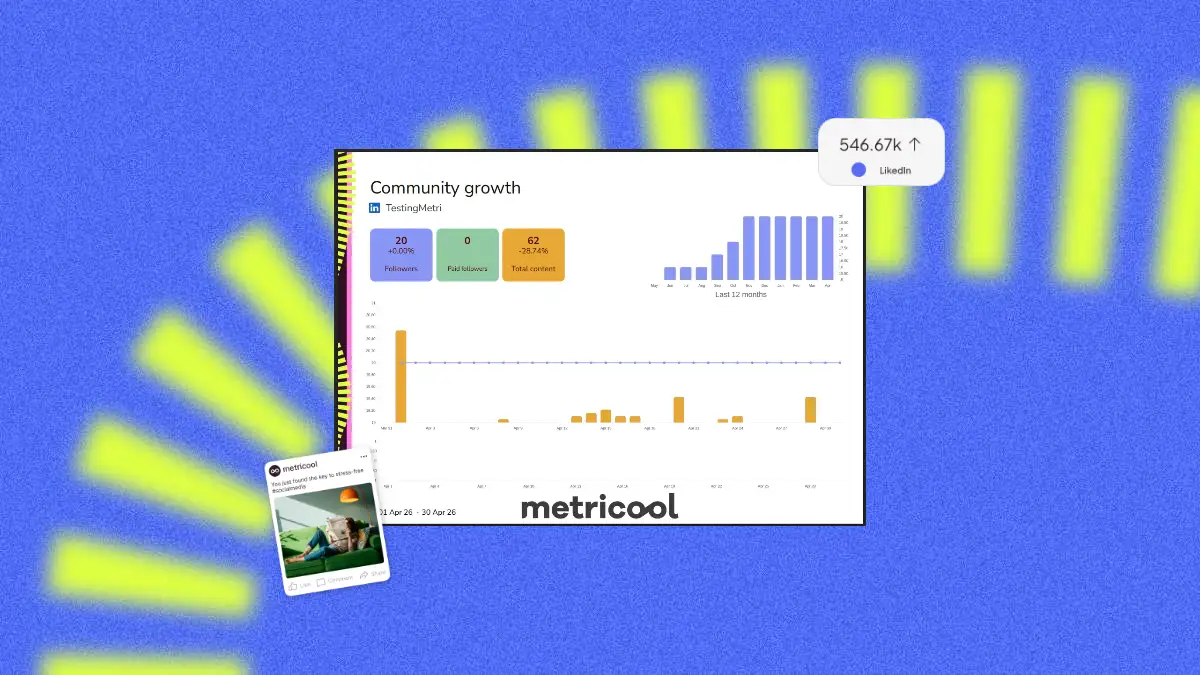
Analyzing your LinkedIn pages has never been easier: Metricool’s LinkedIn analytics reports uncover key insights about your content’s performance, audience interests, top-performing content, and more.
If you’re not familiar with analyzing a LinkedIn profile, welcome to the social media analytics world. Without realizing it, you can make more informed social media marketing decisions, with the right tools. Metricool’s social media analytics reports are key to diving deeper into each platform.
What are LinkedIn Analytics Reports?
LinkedIn analytics reports document your content results, page growth, and audience demographics in a given period. Social media managers, marketers, and content creators use these to measure the impact of their content marketing strategy.
This report is normally shared with a client or marketing team to highlight wins, downfalls, and new opportunities. It can reveal audience insights such as preferred content formats, topic interests, best times to post, and what they are looking for.
Overall, this document serves as a “check-in” to benchmark your social media data and see where you can improve.
Advantages of LinkedIn Analytics Reports
LinkedIn analytics reports are much more than just graphs and numbers. This information can unlock social media holes, revealing how to improve your marketing efforts. So, what are the advantages of these reports?
✅Show off your work to a client or team, detailing your top social media wins and growth.
✅Better understand your audience by analyzing the top-performing content and which industries they work in, to replicate for future content.
✅Keep records of your social media efforts, to compare and improve over time.
✅Measure your content performance: engagement, impressions, clicks, reactions, comments, etc. to continue creating strategic posts.
✅Benchmark against competitors to see where you stand, and where you can improve.
✅Generate new leads and track how effectively your LinkedIn presence drives leads through click-through rates (CTR) and conversion rate metrics.
As you can see, these reports are an indispensable part of your LinkedIn growth. How can you find these reports?
I will tell you about two ways – with LinkedIn’s native analytics tool, or with Metricool’s customizable LinkedIn analytics reports (there are currently three different types to choose from, depending on your specific need).
LinkedIn Native Analytics Reports
LinkedIn offers native analytics tools to measure your account growth directly from the platform. Before you start, make sure you have at least analyst-level admin access to the LinkedIn Company Page.
Here’s how to access and navigate your analytics:
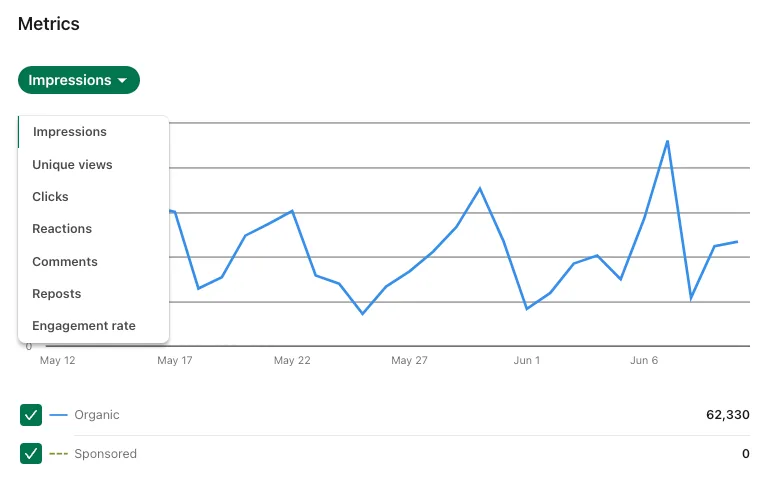
Select the specific metric to measure within each section. At the top, you can also view standout highlights. In the ’Content’ section, for example, you can select impressions, unique views, clicks, reactions, comments, reposts, and engagement rates. The graph will break down organic vs. sponsored metrics.
- Log in to LinkedIn and open your Company Page in admin view.
- Click the Analytics tab in the top navigation menu.
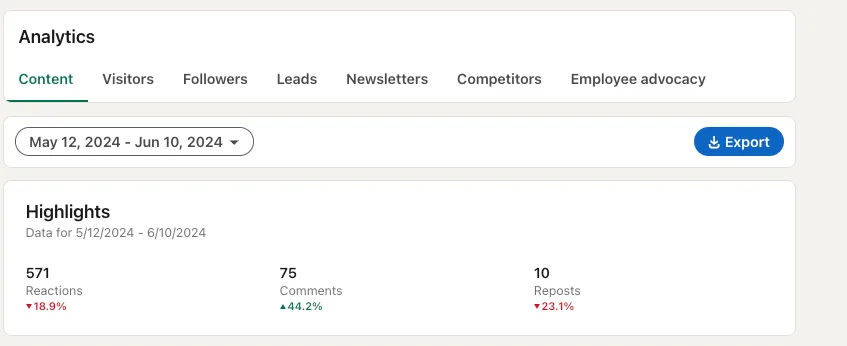
- Choose the category you want to review – inside the dashboard, you’ll see a breakdown by topic: Content, Visitors, Followers, Leads, Newsletters, Competitors, and Employee Advocacy.
- Use the date range filters to set your reporting period.
How to export your LinkedIn analytics:
- Click the Export button in the upper-right corner of the page.
- Choose your timeframe; the last 15, 30, 90, or 365 days, or set a custom range.
- LinkedIn downloads the data as an XLS file. Note that each section exports as a separate file, so if you need Visitors, Followers, and Content data, you’ll be downloading three files individually.
While LinkedIn provides powerful analytics resources, you can’t download all metrics into one document. When it comes to sharing reports with clients or keeping records across multiple accounts, managing separate files can quickly become overwhelming or simply get lost.
With Metricool, you can customize LinkedIn analytics reports to include all data points and design them to fit your brand image.
Custom LinkedIn Analytics Reports with Metricool
Metricool is an all-in-one social media management platform that allows businesses, social media managers, and creators to scale their marketing efforts. One of our fan-favorite features is Reporting.
What is included in this report?
With Metricool’s reports, you can one or multiple social networks. For LinkedIn specifically, you can include the following data points:
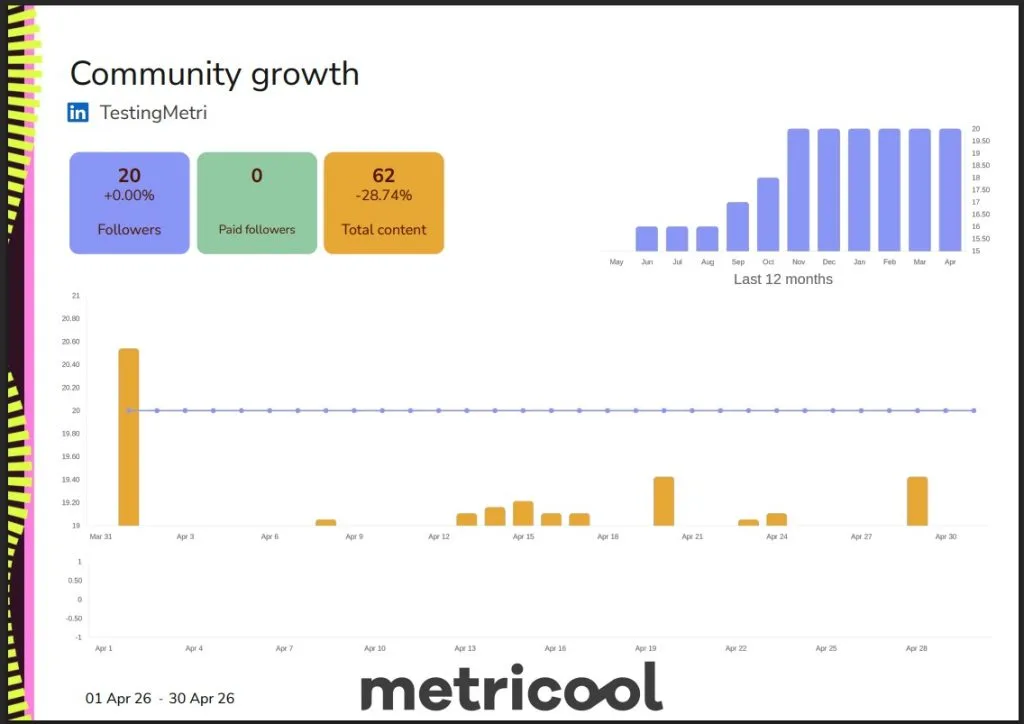
- Community growth: Total number of followers, paid followers, followers over the last 12 months, and follower growth in the period.
- Total page impressions: Impressions over the last 12 months, and impressions in the period.
- Total post interactions: Impressions, interactions, reactions, comments, clicks, shares, and engagement in the period.
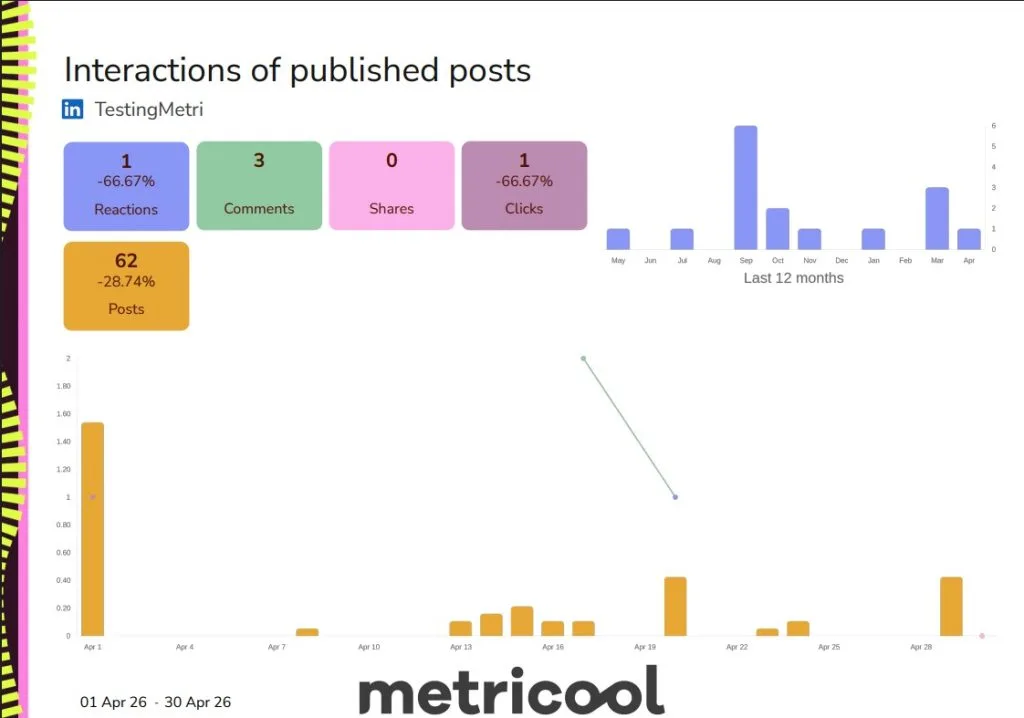
- Total number of published posts: Number of published posts in the period, marked by posting date on the graphs.
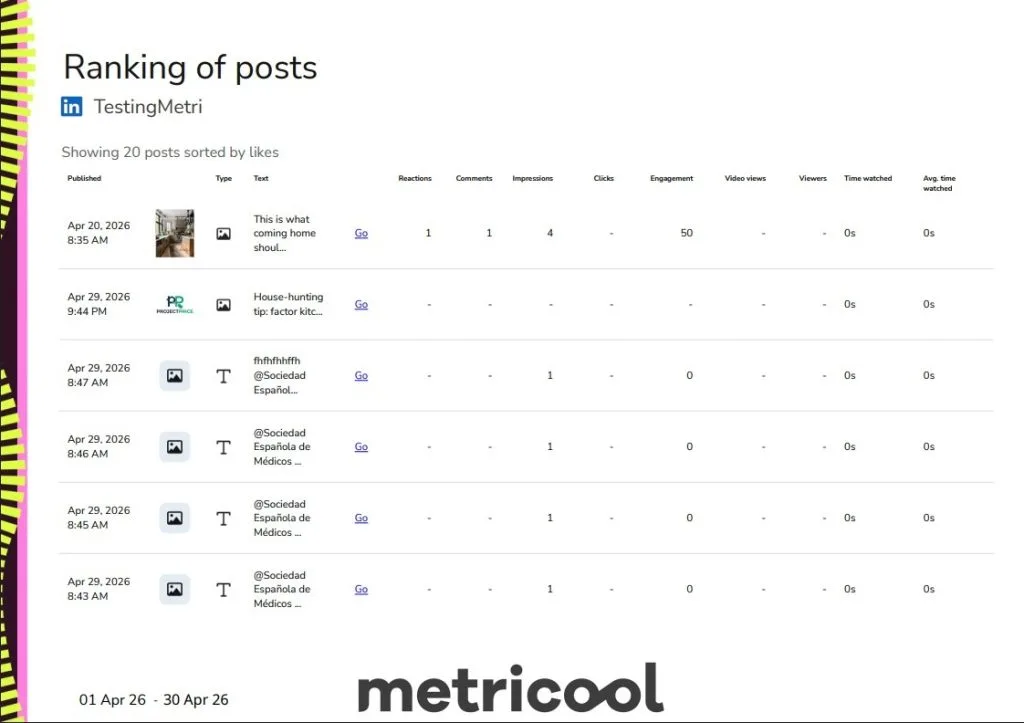
- Rankings of top-performing posts: A list of the top-performing posts including posting date, post type, caption, interactions, clicks, and engagement. View views, viewers, time watched, and average time watched are included for video content.
How to create LinkedIn analytics reports with Metricool
To access Metricool’s reporting feature, you first need an active Metricool account. As this is an advanced feature, you must upgrade to a Premium plan – Starter, Advanced, or Custom. Learn more about Metricool’s plans here:
- Once logged in to Metricool, head to the Analytics section. This will break down your social media data by channel.
- From the tabs above, go to “Reporting”.
- Select the period and language for your report.
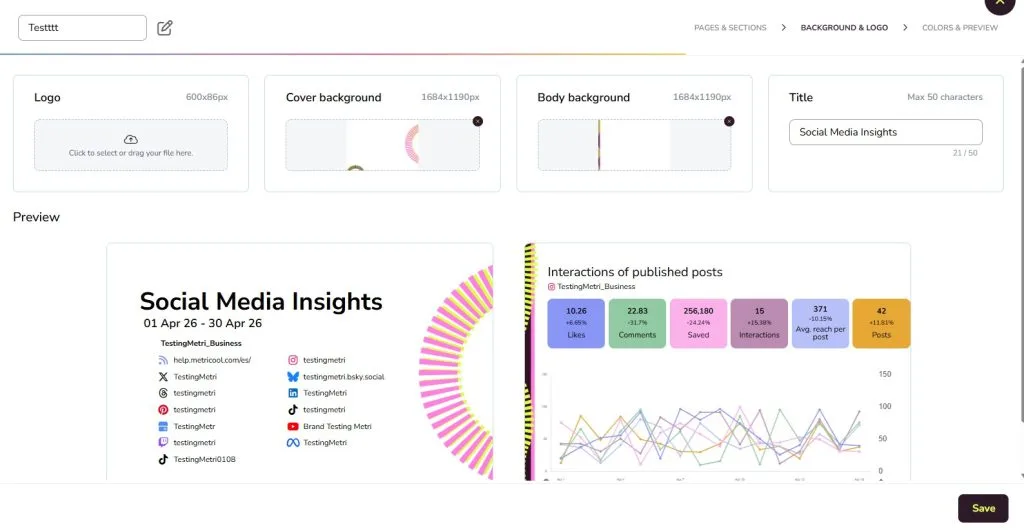
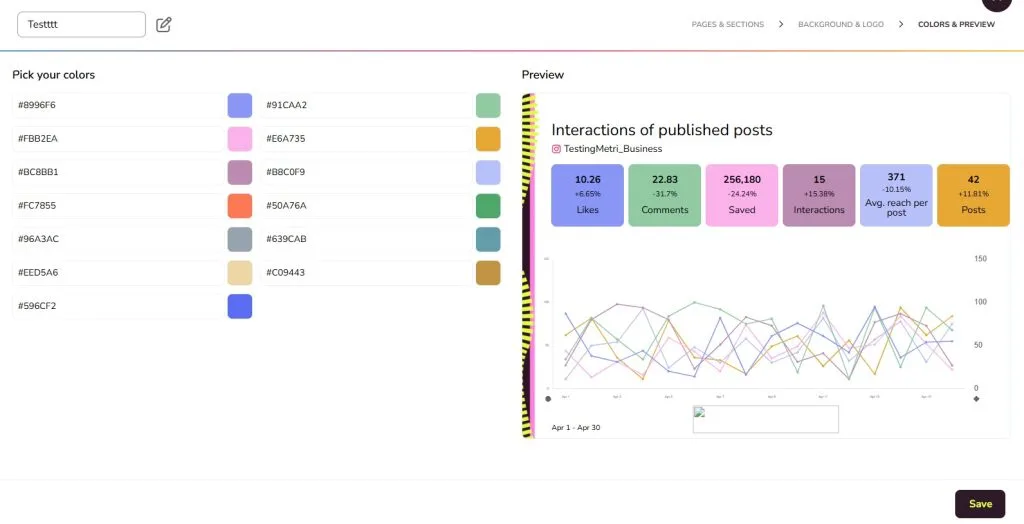
- With an Advanced or Custom plan, click “New template”. Name your template, select the pages and sections, add your brand logo, select background images, title your report, select colors, and preview. Save this template for future use.
- For Starter plans, select the social networks you want to include, and how you want to organize the data.
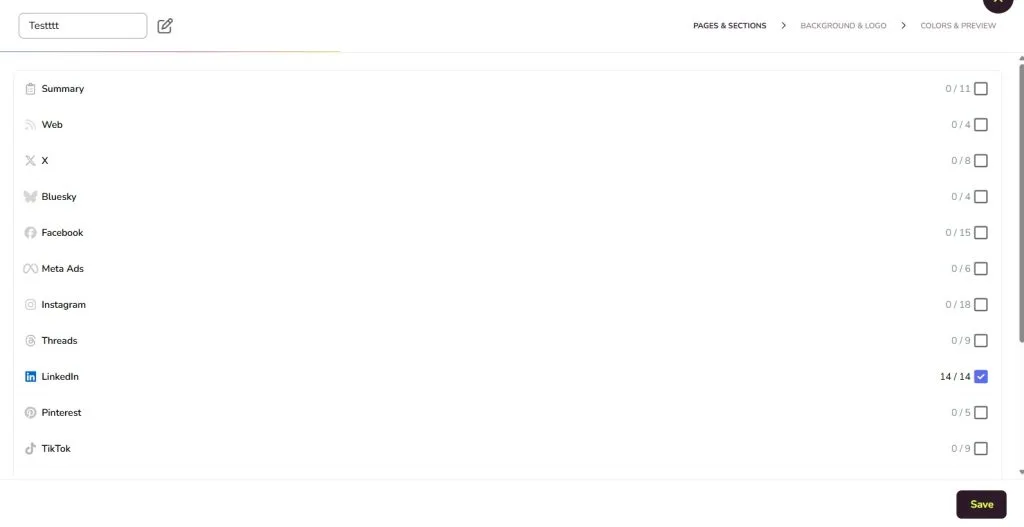
- Add your brand logo, and generate the report in PDF or PPT!
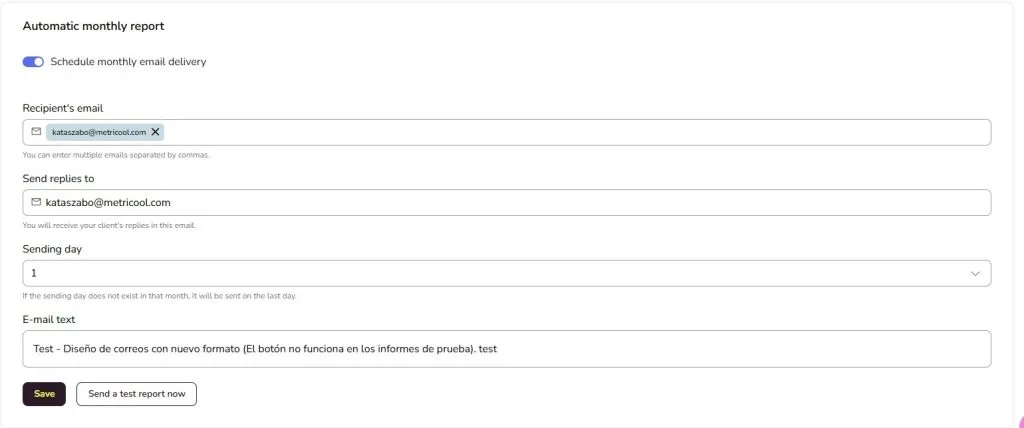
- Finally, to send monthly reports automatically, choose the scheduled day, enter the recipients’ email addresses, and add your custom text. This will be sent automatically on the selected day of the month.
Metricool Studio: AI-Powered LinkedIn Reports
If you want to go beyond standard reports, Metricool Studio is a new AI reporting tool that lets you generate custom reports from a simple question. Instead of manually selecting metrics and building templates, you describe what you want to analyze in plain language and Metricool Studio finds it in your data, builds the charts, and suggests clear next steps.
For LinkedIn specifically, you could ask things like:
- “Which of my LinkedIn posts got the most engagement last month and why?”
- “Compare my LinkedIn performance across the last three months.”
- “What’s the best time to post on LinkedIn based on my own content?”
Generate AI-powered reports with Metricool Studio
Skip the manual setup and get data, charts, and clear next steps just from describing what you want to know in plain language.
Reports can be shared via a public link – no login needed for the recipient – and update automatically, so you never have to rebuild them for a client.
Metricool Studio is currently available as a free add-on, though it will become a paid feature for Starter and Advanced plans in the future.
Campaign Dashboards: Measure LinkedIn as Part of a Bigger Picture
If your LinkedIn content is part of a broader campaign running across multiple platforms, Campaign Dashboards let you group all related content – organic posts, paid ads, across any platform – and analyze it together in one place.
Group LinkedIn content with other platforms in Campaign Dashboards
See the full impact of a campaign across multiple channels in one place, instead of piecing it together one by one.
Instead of jumping between LinkedIn, Meta, and TikTok to piece together campaign results, you tag content to a campaign while scheduling and Metricool combines the results automatically. AI support then helps you interpret what worked.
Like Metricool Studio, Campaign Dashboards are currently free to use but will become a paid add-on for Starter and Advanced plans.
At Metricool, we provide the tools to customize and collaborate, to utilize these reports for your brand or client. If you manage multiple social media accounts, this will be a lifesaver. Want to try it for yourself?
