60+ Social Media Stats Every Marketer Should Know in 2026
 Gretchen Oestreicher
21 January 2026
Gretchen Oestreicher
21 January 2026 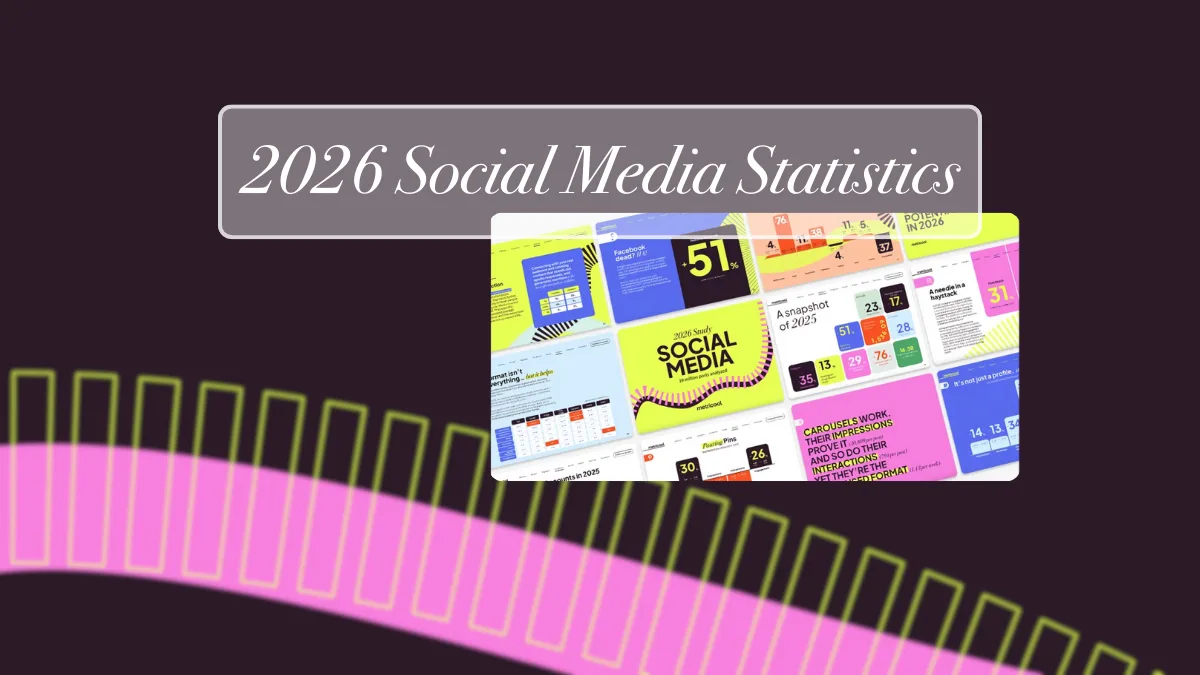
In 2026, social media sits at the center of how people discover brands, follow creators, decide what to buy, and spend their time online. For social media managers, creators, freelancers, and small brands, it also plays a real role in day-to-day work and income. Keeping up is less about chasing every new feature and more about understanding how people actually use these platforms over time.
To help you do that, we’ve pulled together these social media statistics every marketer should know in 2026. These insights are based on large-scale performance data and independent industry research. Use them to check your assumptions, support your strategy, and decide where your effort is best spent this year.
How We Gathered This Data
The statistics in this article come from a combination of Metricool’s social media studies and other trusted industry reports. Together, they reflect patterns across millions of posts and accounts, covering a wide range of platforms, formats, and audience sizes.
Many of these insights come from Metricool’s 2026 Social Media Study, which analyzed 39,762,999 posts from 1,059,949 accounts across all major platforms. We’ve also included relevant data from past Metricool studies and other trusted sources like Statista, Pew Research, and GWI. Together, these statistics give a clear, realistic picture of social media today.
You’ll find the full list of sources at the end of the article if you’d like to explore the data in more detail or trace any specific statistic back to its original study.
Global Social Media Demographics, Usage, And Behavior
- As of October 2025, 68.7% of the world’s population are social media users. (2)
- There are 5.66 billion social media user identities as of October 2025. (7)
- Globally, social media users use an average of 6.75 social platforms each month. (7)
- While on average, online adults use social media 4.21 days each week, people in Japan use social media least frequently (2.65 days/week), and people in Nigeria most frequently (5.84 days/week). (7)
- The average online adult spends an average of 2.5 hours per day consuming social media including video. However, women aged 16-24 spend an average of 3 hours and 40 minutes per day on social media. (7)
- Nearly half (47%) of 16-34 year olds say that “finding new products to purchase” is their main reason for using social media. (3)
- People who use vlogs for product research are the most likely to trust online reviews. (3)
- 54.4% of global social media users identify as male, compared to just 45.6% that identify as female. (7)
Social Media Advertising and Brand Discovery Statistics
- Behind search engines and TV ads, social media ads are internet users’ most important source of brand awareness. (7)
- Over 30% of all digital advertising revenue came from social media advertising. (7)
- Global spend on online search advertising has more than doubled since 2020. (7)
Facebook Statistics
- In 2025 over 3.07 billion people used Facebook monthly. (1)
- Facebook saw a 51% increase in reach, 56% increase in impressions, and 56% increase in interactions in 2025. (1)
- Facebook remains the favored social media platform for all generations except Gen Z (ages 16-27), which is YouTube. (3)
- Over half of all US adults ages 30 to 49 (58%) and 50 to 64 (54%) go on Facebook daily. (5)
Instagram Statistics
- Instagram surpassed 3 billion monthly active users in 2025. (1)
- Half of all US adults say they have used Instagram at least once. (5)
- After WhatsApp, social media users report Instagram as their second “favorite” platform. (7)
- Instagram is the most-used platform for influencer marketing campaigns. (6)
- Despite being the least-used format, carousels see over 3x the interactions compared to single-image posts. (1)
YouTube Statistics
- YouTube’s monthly active users surpassed 2.5 billion in 2025. (1)
- 84% of US adults say they have used YouTube at least once. (5)
- Average views per YouTube video increased by 76% in 2025. (1)
- Shorts see an average of 70 billion daily views. (16)
- YouTube sees 500+ hours of content created every minute. (16)
Bluesky Statistics
- Bluesky has over 41,000,000 total users and is growing at a rate of 0.3 users/second. (14)
- Bluesky has grown 372.5% year-over-year as of June 2025. (13)
- As of October 2025, Bluesky has an average of 3.5 million daily active users on mobile devices. (15)
- Text posts on Bluesky saw an average of 19.90 interactions, while videos saw an average of 23.02 interactions. (1)
Threads Statistics
- In 2025, Threads surpassed 400 million monthly active users. (1)
- Threads daily active users increased by 53% between October 2024 and 2025. (15)
- Millennials are the generation to embrace Threads the most. (3)
- Threads is used most in Taiwan, making it the third most-used app in the region. (3)
LinkedIn Statistics
- There are 1.2 billion registered members on LinkedIn. (17)
- Male LinkedIn members between the ages of 25 and 34 account for the greatest share of global audience (26.8%). (17)
- LinkedIn polls and carousels see 158% and 13% more impressions than average, respectively. (1)
- Carousels generate 247% more interactions compared to other formats on the platform. (1)
TikTok Statistics
- TikTok has more than 1.5 billion monthly active users. (1)
- In 2025, TikTok generated over $26 billion in sales. (1)
- TikTok led the way in 2025 in reach, interactions, and account growth potential, followed by Instagram and then Facebook. (1)
- About half of all US adults ages 18 to 29 use TikTok at least once a day. (5)
- Nearly 2 in 5 US TikTok users have watched a livestream in the last month. (3)
- Women are more likely to choose TikTok as their favorite social media platform over men (17.6% vs. 10.3% respectively). (7)
Pinterest Statistics
- Pinterest surpassed 570 million monthly active users in 2025. (1)
- Over 70% of Pinterest’s users are female. (1)
- Gen Z makes up 42% of Pinterest’s global user base. (8)
- 46% of weekly Pinterest users use the platform to find new brands and products. (1)
- 96% of top Pinterest searches are unbranded. (8)
X (Twitter) Statistics
- The majority (37.5%) of X/Twitter users are ages 25-34, followed by ages 18-24 (32.1%). (9)
- 64.4% of X/Twitter users identify as male, and only 35.4% identify as female. (11)
- The US holds the greatest number of X/Twitter users (105.1M). (10)
- The average X/Twitter user spends more than 32 minutes of their day on the app. (12)
- Reposts and replies saw the greatest increase in 2025, jumping 35% and 21% respectively. (1)
- X/Twitter usage has dropped 13.3% year-over-year between October 2024 and October 2025. (15)
Influencer Marketing Statistics
- The average annual influencer marketing budget increased by 171% between 2024 and 2025. (6)
- Across the board, “building brand awareness and audience affinity through creators” is a top priority for brands of all sizes. (6)
- Over half (53%) of brands overall leverage creator content on brand-owned organic social media. (6)
- 26% of brands cite difficulty in measuring performance as a top roadblock to influencer program growth in 2025. (6)
AI in Social Media Statistics
- 96.01% of people who work in social media use AI as part of their job (72.46% daily). (4)
- 78.99% of people say AI helps them create more social media content in less time. (4)
- 65.58% of people who work in social media say at least half their content is created with the help of AI. (4)
- 95% of brands and 97% of agencies have used AI in marketing over the last year. (6)
- Among marketing professionals, the top two ways companies use AI are for content creation and customer service. (3)
- When it comes to AI-generated content, 60% of consumers are interested in music, 57% in comedy videos, but only 34% in ads and 35% in podcasts. (3)
The Big Picture For Social Media In 2026
All of these stats point to the same thing: social media in 2026 is less about chasing reach and more about earning real attention. Video still leads, but not every video wins. Posts that spark saves, replies, shares, and DMs travel further. AI is everywhere, but it works best as support, not the voice behind your account. And while crowded platforms keep getting louder, quieter ones are giving brands and creators more room to stand out. Above all, community matters more than ever. Reach comes and goes, but people who come back are what hold a strategy together.
If you want to see how these numbers turn into real decisions, workflows, and content ideas, check out Metricool’s 2026 Social Media Trends video. It breaks down what’s changing, what’s working right now, and how to adapt without doing more than you need to.
(1) https://metricool.com/social-media-study/
(2) https://www.statista.com/statistics/617136/digital-population-worldwide/
(3) https://www.gwi.com/reports/social-media-trends
(4) https://metricool.com/ai-social-media-marketing/
(5) https://www.pewresearch.org/internet/2025/11/20/americans-social-media-use-2025/
(6) https://www.creatoriq.com/white-papers/state-of-creator-marketing-trends-2026
(7) https://datareportal.com/reports/digital-2026-global-overview-report
(8) https://business.pinterest.com/en-gb/audience/
(9) https://www.statista.com/statistics/283119/age-distribution-of-global-twitter-users/
(10) https://worldpopulationreview.com/country-rankings/twitter-users-by-country
(11) https://www.statista.com/statistics/828092/distribution-of-users-on-twitter-worldwide-gender/
(12) https://blog.x.com/en_us/topics/company/2023/one-year-in
(13) https://techcrunch.com/2025/07/07/threads-is-nearing-xs-daily-app-users-new-data-shows/
(14) https://bsky-users.theo.io/
(15) https://www.forbes.com/sites/conormurray/2025/11/07/bluesky-and-x-users-plummet-year-after-trumps-election-win-truth-social-makes-small-gains/
(16) https://dataglobehub.com/youtube-statistics-and-insights/
(17) https://datareportal.com/essential-linkedin-stats
