How to Analyze Your YouTube Content: Metrics That Matter in 2026
 Isabel Romero
05 January 2026
Isabel Romero
05 January 2026 
Despite the threat of newer apps, YouTube is still undefeated when it comes to video content. Views on the platform increased by 30% last year, according to our 2026 Social Media Study, so it’s clear why so many solo social media managers, agencies, creators, and entrepreneurs are trying to master YouTube analytics. YouTube has grown into a powerful search engine, a community hub, and a significant channel for building brand authority and driving business objectives. This is why understanding your content’s performance and knowing how to use YouTube analytics to improve your strategy is everything, which is what this article is all about.
If you’ve found yourself wondering which are the most important YouTube metrics to track, what conclusions you can draw from YouTube analytics, and steps you can take to improve your results, then this guide is for you.
What Are YouTube Analytics?
YouTube analytics is the collection of data and statistics that reveal how your videos and channel are performing. It’s the behind-the-scenes data that tells you who’s watching, what they’re watching, how long they’re watching, and how they’re finding your content. Without this data, optimizing your YouTube strategy is like driving blindfolded.
These insights cover a wide range of YouTube metrics, from basic views and watch time to more complex audience demographics, traffic sources, and subscriber growth. For any serious creator or marketer on YouTube, understanding these numbers is the key to making informed decisions, identifying growth opportunities, and improving content.
How to See YouTube Analytics: Via YouTube Studio
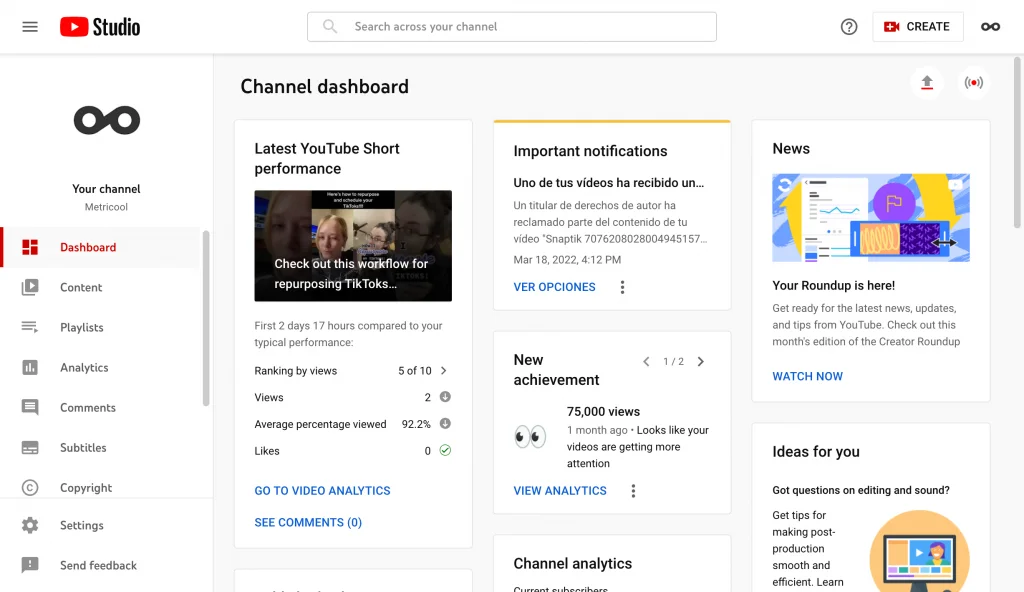
The primary way to access your channel’s data directly within the YouTube platform is through YouTube Studio. This is where you can find information about your videos and overall channel performance.
Steps to access YouTube Analytics in YouTube Studio:
- Sign in to YouTube: Go to YouTube.com and sign in with the Google account associated with your YouTube channel.
- Access YouTube Studio: Click on your profile picture in the top right corner. From the dropdown menu, select “YouTube Studio.”
- Navigate to Analytics: In the left-hand menu of the YouTube Studio dashboard, click on “Analytics.”
Once in the Analytics section, you’ll find various tabs that break down your channel’s performance:
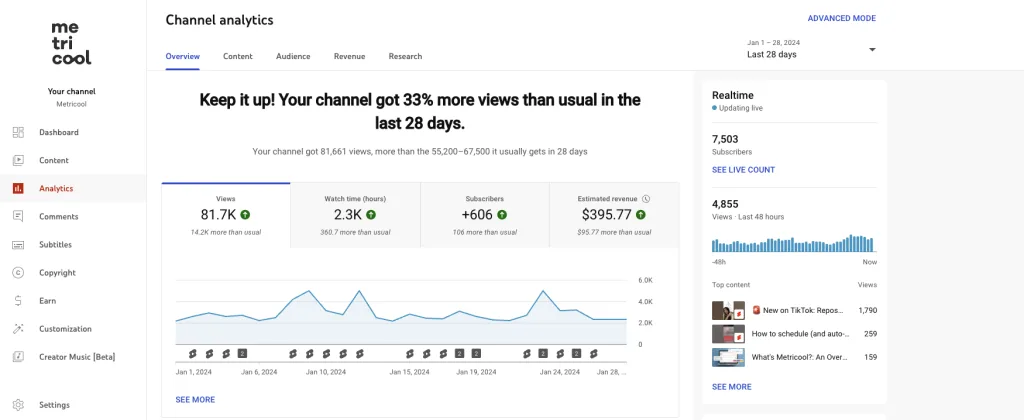
- Overview: This gives you a quick snapshot of your channel’s key YouTube metrics over a chosen period, including views, watch time, subscribers, and estimated revenue (if monetized). You’ll often see graphs showing trends for these metrics.
- Content: This tab provides detailed performance data for individual videos, Shorts, and Live streams. You can see how each piece of content is performing across various metrics and sort by reach, engagement, and audience retention.
- Audience: Here, you’ll gain insights into who your viewers are. This includes subscriber demographics (age, gender, geography), when your viewers are on YouTube, what other channels they watch, and what other videos they’ve watched. This information is invaluable for tailoring your content to your target demographic.
- Revenue (if monetized): For monetized channels, this tab breaks down your earnings, traffic sources for revenue, and top-earning content.
- Research: This newer section helps you discover what your audience is searching for on YouTube, and what content gaps you might fill. It provides insights into trending topics and content ideas.
How to check YouTube analytics for specific videos:
- From the “Content” tab in YouTube Studio, you’ll see a list of your videos.
- Hover over a video and click on the analytics icon (a bar chart) that appears next to it.
- This will open detailed analytics for that specific video, allowing you to dive deep into its reach, engagement, and audience retention.
Knowing how to read YouTube analytics within Studio involves understanding the graphs, tables, and definitions provided. YouTube’s interface is generally user-friendly, with tooltips and explanations for many metrics. You can also adjust the date range to compare performance over different periods.
The 7 Most Important YouTube Metrics to Track (And How to Use Them)
While YouTube Studio offers a lot of data, knowing which YouTube channel metrics to focus on is crucial for making effective decisions. Here are the 7 most important metrics that you need to track, and how you should use them to improve your YouTube strategy.
1. Watch Time (and Average View Duration)
Watch time is a primary ranking factor for YouTube’s algorithms; it is the total amount of time viewers have spent watching your videos. Average view duration is the average amount of time viewers spend watching a single video. The more watch time your channel accumulates, the more likely YouTube is to recommend your content. High average view duration indicates that your content is engaging and holding viewers’ attention.
How to use it: Find out which of your videos have the highest watch time and average view duration to understand what keeps your viewers engaged. Try to repeat common factors(e.g., topic, pacing, format) in your future content. If a video has a low average view duration, analyze where viewers drop off to identify areas for improvement.
2. Views
The Views metric tells you the number of times your video has been watched. While often seen as a vanity metric, views still indicate reach and initial audience interest. It’s a fundamental measure of content consumption.
How to use it: Track trends in views to see if your channel is growing. Compare views across different content types to see what resonates.
3. Subscribers (and Subscriber Gains/Losses per video)
This is the number of users who have subscribed to your channel. Subscriber gains/losses per video tell you which videos are attracting (or losing) subscribers. Subscribers are your most loyal audience; they’re more likely to watch new content and are a strong signal of channel growth.
How to use it: Identify videos that drive significant subscriber growth. These are your “subscriber magnets” – create more content like them. Understanding losses helps you address potential issues.
4. Traffic Sources
The traffic sources metric lets you know where your viewers are coming from (e.g., Youtube, Suggested Videos, Browse Features, External Websites, Direct or Unknown). This tells you how discoverable your content is and where your marketing efforts are paying off.
How to use it: If “YouTube” is high, your SEO is working. If “Suggested Videos” is high, YouTube is recommending your content effectively. A high “External” traffic source might indicate successful promotion on social media or your website.
5. Audience Retention
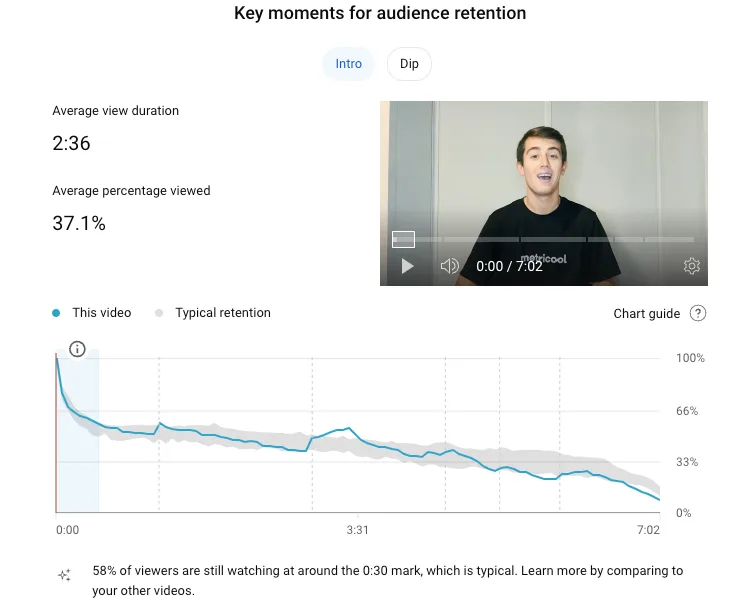
The audience retention metric is displayed in a graph showing the percentage of viewers who continue watching your video at each moment. This metric tells you exactly where viewers are engaged and where they drop off. As per a July 2025 update, YouTube also provides more specific viewer data, categorizing your audience into “New viewers”, “Casual viewers” and “Regular viewers”
How to use it: Look for “spikes” (moments of increased rewatch) and “dips” (points where many viewers leave). Analyze what happened at those points to refine your video intros, pacing, and overall narrative. Pay close attention to the first 30 seconds, as this is critical for hooking viewers.
6. Click-Through Rate (CTR) of Thumbnails & Titles:
CTR is the percentage of people who saw your video (in search, suggested, etc.) and actually clicked on it is a direct measure of how compelling your thumbnail and title are. A high CTR indicates that your content is appealing and discoverable.
How to use it: Experiment with different thumbnails and titles. Compare CTRs to find out what works best for attracting clicks.
7. Engagement Metrics (Likes, Dislikes, Comments, Shares):
Interactions on your videos signal audience interest and emotional response. Comments, in particular, indicate a high level of engagement and community.
How to use it: Encourage comments and interaction. Analyze which types of content generate the most conversation. Shares indicate that your content is valuable enough for viewers to spread it to their networks.
By focusing on these core YouTube channel metrics, you can move beyond simply seeing numbers to truly understanding your performance and making data-driven decisions.
YouTube Analytics: Advanced Mode
In this section, you can dive into more specific information about how your channel is performing.
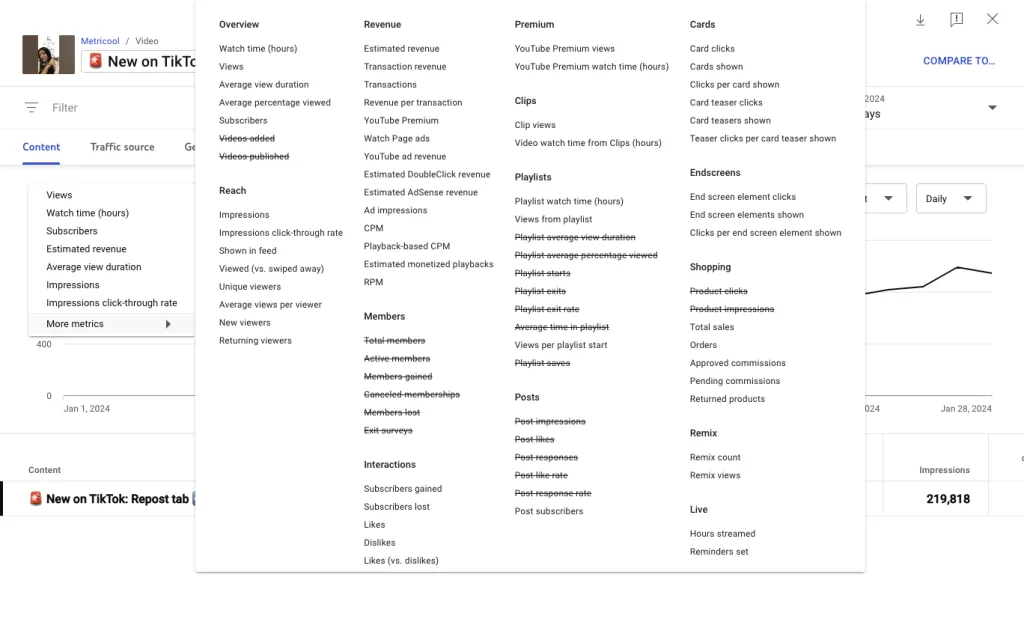
Depending on the parameter that you are interested in analyzing you can choose from: video, traffic source, geography, viewer age and gender, publication date, subscription status, subscription source, playlist, device type, YouTube products, playback location, operating system, video cards
Also, you will be able to compare metrics or change the date on graphs, and show the information with lines or bars. YouTube Studio’s Advanced Mode has just about every metric possible. If you don’t believe me, just look at the list of metrics:
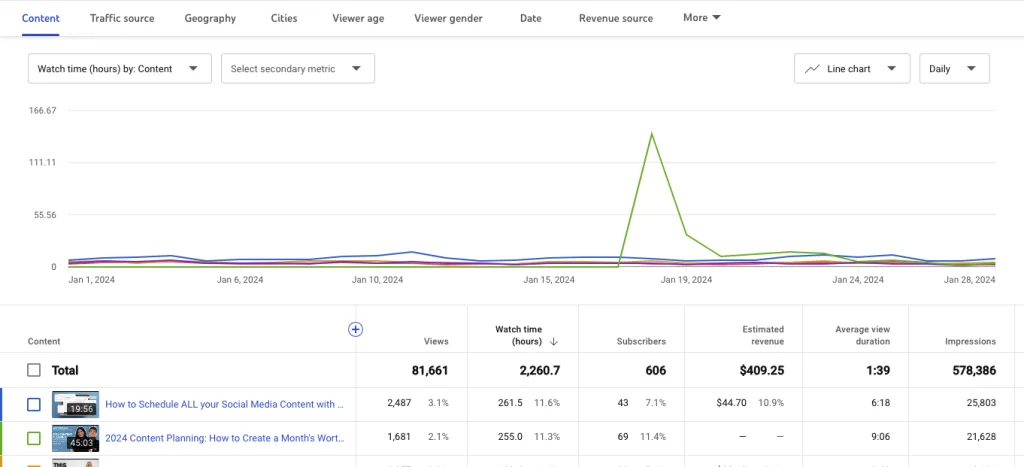
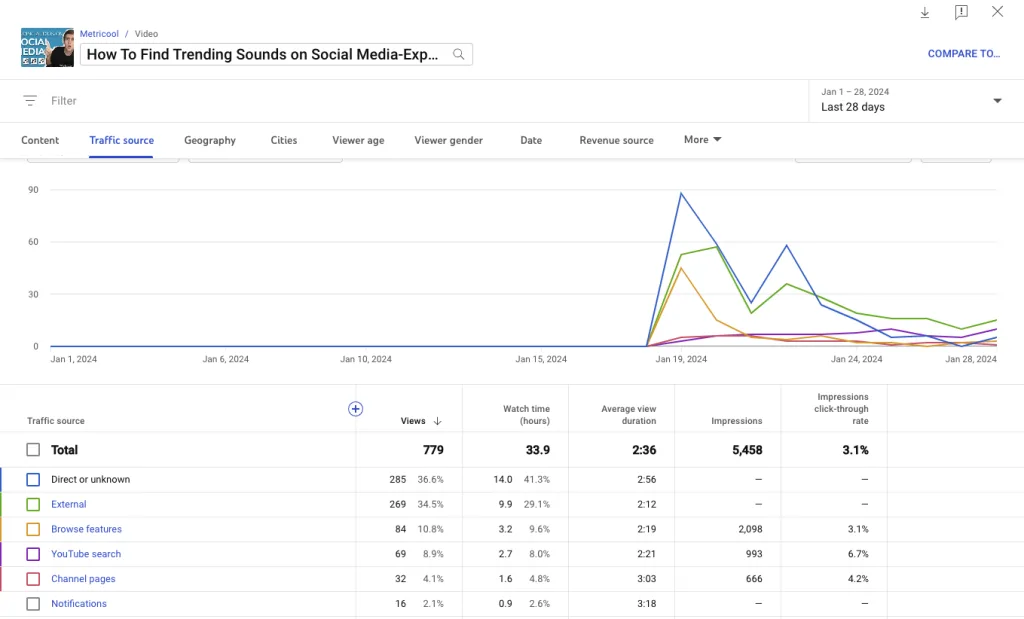
- Content: In this tab, you can see a graph with the top 5 videos by views, organized by colors. If you are interested in comparing videos, you can combine metrics with the options that appear under the drop-down menus and select a secondary metric.
For example: You can compare the time watched and views per video to see the differences between them.
- Traffic Source: YouTube provides information about where your views are coming from, including the views, time watched and average view duration for each traffic source.
- Geography: Info about views per region. You can also see data about time watched and average view duration.
- Cities: See which cities most of your views are coming from, with a breakdown of where your views come from per city.
- Viewer Demographics: In this section, you will discover info like if your content attracts more men or women, or if it gets more views amongst a young or an older audience.

- Date: How has your YouTube channel been performing recently? On this graph, you can monitor the recent performance of your videos.
- Revenue source: If you have revenue sharing turned on, you can view all your revenue sources and income inside this tab.
- Subscription Status: Separate viewers into subscribers and non-subscribers
- Subscription Source: Data about the subscriber’s source, views and time watched, and whether you’re gaining or losing subscribers.
- Playlist: Insights about the traffic generated by your playlists, such as views and time watched.
- Device Type: Nowadays, it’s easy to access the content from any device. Here you will know which platform your viewers use the most to watch your videos.
- YouTube Products: Here you will find the views obtained by each YouTube product: YouTube, YouTube Kids, or Gaming. You will see the views of each one.
- Playback Location: Metrics about views or time watched by playback location such as YouTube watch page, embedded player on other platforms, or mobile devices.
- Operating System: In this section, you gather information about which operating systems your views come from, e.g., Macintosh, iOS, Android, etc.
- Subtitles and language: Here you can check the number of views and times watched that used subtitles/cc and the languages.
- Video Cards: If you didn’t know, you can add cards to your YouTube videos to make them more interactive.For instance, a call to action to other videos at the end, surveys during the video, or links to other channels. Here, you can track the number of clicks and interactions per type of card, apart from the views.
- Shares: On this tab, you can check how many times your videos have been shared and how (via WhatsApp, Facebook, Instagram, etc.)
As you can see, the metrics offered by YouTube Analytics are extensive, and you can get very insightful information. Now you know how to analyze YouTube videos and take your strategy to the next level.
How to Use YouTube Analytics: From Data to Action
Knowing how to read YouTube analytics is just the beginning. The real power comes from taking those insights and applying them to your content strategy.
- Content Ideation: Use “Research” data to find out what your audience is searching for. Look at competitor channels (if you’re using a tool like Metricool that allows this) to identify content gaps or popular topics you can cover.
- Optimize Existing Content: For videos with good but not great audience retention, consider adding end screens, cards, or mid-roll ads at points after major drop-off points. Update descriptions or titles if CTR is low.
- Refine Future Content: If your analytics show that your audience consistently drops off after your intro, work on more compelling hooks. If a specific segment of your video performs exceptionally well, consider creating more content on that micro-topic.
- Target Your Audience: Use demographic data to tailor your language, examples, and visual style to resonate more deeply with your core viewers. If you find a new audience segment, consider creating content specifically for them.
- Improve SEO: Use data from “YouTube” traffic sources to identify keywords viewers use to find your content. Incorporate these keywords naturally into your titles, descriptions, and tags for future videos.
- Plan Your Publishing Schedule: If your “When your viewers are on YouTube” data shows peak activity on Tuesdays and Thursday evenings, schedule your major content releases during those times.
- Cross-Promotion Strategy: If “External” traffic sources are high from a specific social media platform, double down on promoting your YouTube videos there.
- Monetization Strategy (for creators): Understand which content generates the most revenue and optimize for ad placement or product integration in those types of videos.
In essence, knowing how to use YouTube analytics means transforming raw data into a continuous feedback loop that informs every aspect of your YouTube content creation and distribution.
Why Metricool is the Best Option for YouTube Analytics
While YouTube Studio provides valuable native analytics, Metricool offers a superior, more integrated, and comprehensive solution for solo social media managers, agencies, creators, and entrepreneurs looking to truly master their YouTube channel performance.
Here’s why Metricool stands out:
- Unified Dashboard for All Digital Marketing Efforts: Centralize analytics for all your social media platforms (Facebook, Instagram, TikTok, LinkedIn, X, Pinterest, etc.), your website (Google Analytics), and even your online advertising campaigns (Meta Ads, Google Ads, TikTok Ads).
- Streamlined Cross-Platform Reporting: Generate professional, customizable reports that include all your social media and website data, including YouTube. Integrated Planning and Publishing: With Metricool, you can not only analyze your YouTube channel but also plan and schedule your YouTube videos directly within the same platform.
- Actionable “Best Times to Post” for YouTube: Metricool analyzes your specific audience’s behavior on YouTube to recommend the absolute best times to publish your videos for maximum reach and engagement.
- Robust Competitor Analysis: Metricool provides powerful tools to track and compare your YouTube channel’s performance against competitors.
- Intuitive Interface: Metricool’s dashboard is designed for clarity and ease of use, making knowing how to read YouTube analytics simple, even for those new to data analysis.
- Community Management: While not directly tied to analytics, Metricool’s unified inbox allows you to manage comments on your YouTube videos alongside comments from other social media platforms, streamlining your community engagement.
Knowing how to use YouTube analytics effectively means moving beyond raw numbers to actionable insights. Metricool empowers you to do exactly that, providing the context and cross-platform comparisons needed to make truly informed decisions about your YouTube strategy. By bringing all your data together in one place, Metricool helps you save time, reduce complexity, and focus on what matters most: growing your audience and achieving your business objectives on YouTube and beyond.
How to See YouTube Analytics for Other Channels (Competitor Analysis)
While YouTube Studio only gives you access to your own channel’s analytics, understanding how to see YouTube analytics for other channels is a crucial part of competitor analysis. You won’t get their private data (like watch time or audience retention), but you can gather significant public information.
Publicly Available Metrics:
- Subscriber Count: Visible on their channel page.
- Total Views: Also visible on their channel page.
- Views per Video: By looking at individual videos, you can see how many views they’ve garnered.
- Engagement Ratios: You can estimate engagement by comparing likes, comments, and views on individual videos.
- Upload Frequency: By looking at their video uploads, you can observe their publishing rhythm.
- Content Themes & Formats: What topics do they cover? What video lengths and styles do they use?
- Traffic Source (Inferred): By analyzing their video titles and descriptions, you can infer their SEO strategy.
Using Third-Party Tools for Competitor Analysis:
While YouTube doesn’t offer native competitor analysis tools, many third-party social media management platforms do. Metricool is an excellent example.
Metricool’s Competitor Analysis Feature: Within Metricool, you can connect your own YouTube channel and then add competitor channels for tracking. Metricool pulls publicly available data and presents it in a comparative format. You can see:
- Their subscriber growth.
- Their overall views and video views.
- Their most popular videos.
- Their posting frequency.
- Key engagement metrics like likes and comments.
This allows you to benchmark your performance against rivals, identify their successful content strategies, and find content gaps you can fill. It’s a powerful way to how to find YouTube analytics insights on others without direct access.
YouTube Analytics FAQs
Navigating the nuances of YouTube analytics can sometimes feel a bit like deciphering a dynamic puzzle. For solo social media managers, agencies, creators, and entrepreneurs, having clear answers about how this data functions is key to trusting and acting on the insights. Here are some common questions about YouTube’s data updates and accuracy.
When do YouTube Analytics update?
YouTube Analytics typically updates once every 24 to 48 hours for most standard reports. This update usually happens based on the Pacific Time Zone (PST). So, depending on your geographical location, you might see the new data appearing at different times of the day.
How often does YouTube Analytics update?
For the majority of your performance metrics, like views, watch time, and subscriber counts, YouTube Analytics updates every 24 to 48 hours. This means that a full day’s data from, say, Monday, will usually be processed and visible by Wednesday. However, it’s worth noting that some real-time data, like current viewer counts on a live stream, will update much more frequently. Estimated earnings data in YouTube Analytics also typically updates daily, but with a delay of approximately two days.
How long does YouTube Analytics take to update?
Generally, it takes anywhere from 48 to 72 hours for YouTube Analytics to provide a complete and verified update for all your video and channel performance data. While you might see some preliminary numbers sooner, waiting at least 48 hours after a specific day or a video upload ensures you’re looking at the most accurate and processed information. Checking too frequently within this window can sometimes show incomplete or slightly inaccurate figures.
Are YouTube Analytics accurate?
Yes, YouTube Analytics are generally considered very accurate. YouTube employs robust systems to filter out invalid activity (like bot views or artificially inflated metrics) to ensure that the data you see reflects genuine audience engagement. While there can be slight delays as data is processed and verified, the information provided directly in YouTube Studio is reliable. It’s important to rely on official YouTube data rather than external services claiming real-time accuracy for view counts, as these are often not as precise. Factors like ad blockers or private browsing modes can sometimes lead to slight underreporting, but YouTube strives to present the most truthful picture of your channel’s performance.
