Pinterest Analytics: How to Measure Your Pin Results

Pinterest is more than just a visual discovery platform— with over 498 million monthly active users it’s a powerful marketing tool that can drive traffic, increase brand awareness, and boost conversions. But to make the most of your Pinterest strategy, you need to track and understand your performance. That’s where Pinterest Analytics comes in.
In this guide, we’ll explore everything you need to know about Pinterest Analytics and how you can use Metricool to streamline your analysis and improve your Pinterest strategy.
What is Pinterest Analytics?
Why Use Pinterest Analytics?
Pinterest Analytics helps you measure the impact of your content by providing insights into impressions, engagements, outbound clicks, and audience demographics. With this data, you can:
- Optimize your pinning strategy to maximize reach and conversions.
- Understand which pins perform best.
- Identify trends and patterns in audience engagement.
How to See Pinterest Analytics
Pinterest provides a built-in analytics dashboard that gives you access to valuable data about your content’s performance. With these insights, you can refine your marketing strategy and improve engagement.
Accessing Pinterest Analytics
To access Pinterest Analytics, you need a Business account. Once set up, follow these steps:
- Log in to your Pinterest Business account.
- Click on Analytics in the top-left menu.
- Choose from the following analytics sections:
- Overview: Get a high-level snapshot of your Pinterest performance.
- Audience Insights: Learn about your followers’ demographics, interests, and behaviors.
- Conversion Insights: Track your paid campaigns’ performance and their impact on conversions.

Source: Pinterest Business Hub Dashboard
Navigating Your Pinterest Analytics Dashboard
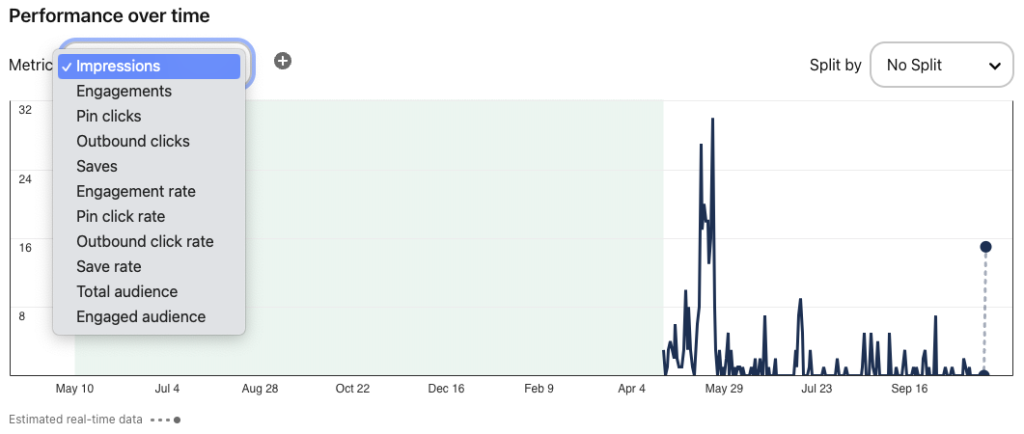
Once inside the Pinterest Analytics dashboard, you will see various data visualizations and reports that help you track performance.

Source: Pinterest Analytics
Here’s how to make the most of it:
- Filter your data: Use filters to analyze performance by date range, pin format (image, video, carousel), and content type (organic or paid).
- View top-performing pins: Identify which pins generate the most engagement, impressions, and outbound clicks.
- Analyze board performance: See which boards attract the most engagement and saves.
- Check audience insights: Understand who your audience is, what devices they use, and their preferred categories.
- Export reports: Download performance reports in CSV or PDF format for further analysis or sharing with your team.
By leveraging Pinterest’s built-in analytics tools, you can refine your strategy and maximize the impact of your content.
16 Important Pinterest Analytics Metrics to Track
To get the most out of your Pinterest marketing efforts, tracking the right metrics is crucial. Understanding these key analytics will help you fine-tune your strategy, improve engagement, and maximize your results. Here are 16 essential Pinterest Analytics metrics to focus on.
1. Pin Impressions
💡 Definition: The number of times your Pins were on screen.
Impressions indicate how often your content appears on users’ screens, whether in their feeds, search results, or category feeds. Tracking impressions helps identify which content gains visibility, whether organically or through Pinterest’s algorithm favoring certain topics or formats.
2. Pin Clicks
💡 Definition: The total number of clicks on your Pin or ad so it opens in closeup.
Pin clicks measure user interest. If your pin is getting clicks, it means your design, title, or description is engaging enough to prompt further interaction.
To improve pin clicks:
- Use eye-catching visuals and clear, readable text overlays.
- Craft compelling titles that spark curiosity or offer clear value.
- Include a strong call-to-action (CTA) in your pin description.
3. Pin Click Rate
💡 Definition: The total number of clicks from your Pin or ad content on or off Pinterest, divided by the total number of times your Pin or ads were on screen.
A strong click rate indicates your pin is capturing audience attention effectively. This metric helps you with understanding how well your content drives engagement relative to impressions.
4. Saves
💡 Definition: The number of times your Pins were saved to a board.
Saves signal user interest and long-term intent. If users are saving your pins, they likely plan to revisit the content later, making this a strong metric for engagement and content relevance.
To increase saves of your Pins:
- Create evergreen content that remains relevant over time.
- Use descriptive board names with relevant keywords.
- Consistently pin high-quality content to establish trust with your audie
5. Save Rate
💡 Definition: The total saves of your Pins divided by the total number of times your Pins were on screen.
A high save rate suggests your content is resonating with users and prompting them to store it for later. This metric helps assess your content’s staying power and relevance.
6. Engagement
💡 Definition: The total number of engagements on your Pins, including clicks, saves, and outbound clicks.
Engagement is a core performance indicator. High engagement means users are actively interacting with your content, which improves your overall visibility on Pinterest.
To boost engagement on Pinterest:
- Use Pinterest’s latest features, such as Idea Pins or video content.
- Post consistently, aiming for at least one pin per day.
- Engage with other users by commenting and sharing their content.
7. Engagement Rate
💡 Definition: The total engagements with your Pins divided by the total number of times your Pins were seen.
A strong engagement rate signifies content effectiveness. If engagement is low despite high impressions, consider refining your pin design, descriptions, or posting strategy.
8. Outbound Clicks
💡 Definition: The number of clicks to the destination URL associated with the Pin.
Outbound clicks measure how well your content drives traffic to external sites, making this one of the most valuable metrics for tracking conversions and lead generation. To optimize outbound clicks:
- Ensure your pin accurately represents the linked content.
- Use clear CTAs that tell users what to expect when they click.
- Optimize your website for mobile users, as many Pinterest users browse on mobile devices.
9. Outbound Click Rate
💡 Definition: The total number of clicks to the destination URL divided by the total number of times your Pins were on screen.
A high outbound click rate means users find your content compelling enough to take action. Optimize this by ensuring clear calls to action and relevant, visually engaging pins.
10. Total Audience
💡 Definition: The number of Pinners who have seen or engaged with your Pins.
Tracking total audience helps you understand your content reach and identify trends in audience growth over time.
To grow your audience:
- Use relevant keywords in your profile description and board titles.
- Collaborate with other Pinterest users in your niche.
- Participate in group boards to expand your reach.
11. Engaged Audience
💡 Definition: The number of Pinners who have engaged with your Pins.
Engaged audience metrics reveal how many unique users actively interact with your content, a crucial metric for assessing user retention and brand loyalty.
12. Video Views
💡 Definition: The amount of views for at least 2 seconds with 50% of video in view.
Short video views indicate the initial effectiveness of your content. With video content gaining popularity on Pinterest, pay attention to:
- Creating attention-grabbing intros to boost video views.
- Optimizing for silent viewing with captions or text overlays.
- Keeping videos concise, ideally between 15-30 seconds.
13. Average Video Play Time
💡 Definition: The average time someone spent playing the video and static image cards included in your Pin.
This metric highlights audience retention. Videos with longer play times tend to be more engaging and informative.
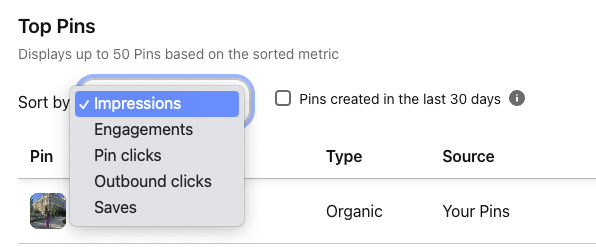
14. Top Pins
💡 Definition: The top-performing content pieces by engagement, impressions, outbound clicks, and saves.
Analyzing your best-performing content helps you:
- Identify successful themes or topics.
- Replicate effective design elements or content structures.
- Refine your overall Pinterest strategy based on what works.

Source: Pinterest Analytics
15. Top Boards
💡 Definition: The top-performing Pinterest boards by engagement, impressions, outbound clicks, and saves.
Understanding which boards perform best helps refine your Pinterest organization and content strategy.
16. Audience Insights
💡 Definition: Your total or engaged audience’s demographics including categories and interests, age ranges, gender split, locations, and device preferences.
Use audience insights to tailor your content and advertising efforts for better engagement and conversions. To enhance audience insights:
- Create content that resonates with your audience’s interests and preferences.
- Schedule pins when your audience is most active.
- Use Pinterest Ads to target specific demographics or interests.
Pinterest Analytics with Metricool
Metricool enhances Pinterest Analytics by offering a detailed breakdown of your performance, giving you actionable insights to improve your strategy. Below are the key sections of Metricool’s Pinterest Analytics dashboard:
Pinterest Community Growth
Metricool provides an in-depth view of your audience growth, helping you analyze follower trends, pin activity, and engagement levels over time.
- Growth Chart: Monitor follower trends, the number of users you follow, and pins posted over time.
- Balance of Followers: Track changes in your follower count to understand growth patterns.
- Average Daily Followers: See how many new followers you gain per day to gauge long-term growth.
- Followers per Pin: Understand how each pin contributes to follower acquisition.
- Following Trends: Observe patterns in the accounts you follow and how they influence your engagement.
- Pin Posting Activity: Track the average number of pins posted daily and weekly to maintain consistency in your strategy.
Pin Performance Metrics
Metricool provides an in-depth look at how your pins perform across various engagement metrics.
- Impressions Over Time: Track how often your content appears on users’ feeds.
- Engagement Analysis:
- Total Engagement: Summarizes all interactions with your pins, providing an overall engagement score.
- Interactions Breakdown: Analyze key engagement metrics, including pin clicks, outbound clicks, and saves.
- Pins Posted: Monitor your posting frequency and its impact on engagement levels.
Organic Pin Data
Metricool allows you to track organic pin performance in depth. You can analyze individual pins with the following metrics:
- Impressions: The number of times a pin was displayed on Pinterest.
- Saves: How many times a pin was saved to a board, indicating user interest.
- Pin Clicks: The number of users who clicked on a pin to view it in more detail.
- Outbound Clicks: How often users clicked a pin to visit the associated website, measuring traffic effectiveness.
- Video Views: The total views on video pins, reflecting user engagement with video content.
- Average Watch Time: Measures how long users engage with video content, providing insights into viewer retention.
With Metricool’s analytics features, you can monitor trends, optimize pinning frequency, and refine your strategy to improve engagement and drive traffic more effectively. This detailed data allows you to pinpoint which pins resonate with your audience, making it easier to craft more engaging and high-performing content.
Using Pinterest Analytics to Refine and Optimize Your Marketing Strategy
Pinterest Analytics is a powerful tool that helps you adjust and optimize your marketing strategy based on real data. Here’s how you can use the insights from Pinterest Analytics to improve your Pinterest marketing efforts:
1. Identify High-Performing Content
By analyzing impressions, saves, and engagements, you can identify which pins perform best. Use this data to:
- Replicate successful design and messaging elements in future pins.
- Focus on content formats (static images, videos, or carousels) that generate the most interaction.
- Adjust posting frequency based on the engagement trends.
2. Optimize Posting Schedule
Analyze engagement patterns to determine when your audience is most active. Experiment with different posting times and:
- Use Pinterest Analytics to see when your pins receive the most impressions and interactions.
- Schedule pins during peak engagement hours to maximize visibility.
- Maintain a consistent posting strategy based on these insights.
3. Improve Audience Targeting
Pinterest Analytics provides demographic and interest data about your audience. Use this information to:
- Tailor your content to your audience’s preferences.
- Create targeted campaigns based on user interests and behavior.
- Identify gaps in your strategy and expand into new, relevant topics.
4. Enhance Pin Design and Descriptions
Metrics such as pin clicks and outbound clicks help you understand which visuals and descriptions resonate most with users. Use these insights to:
- Test different color schemes, fonts, and styles to see what attracts more engagement.
- Refine pin descriptions by including relevant keywords and clear calls to action.
- Use compelling headlines and informative captions to increase engagement.
5. Monitor Conversion Performance
If driving website traffic and conversions is your goal, track outbound clicks and conversion metrics to:
- Determine which pins generate the most referral traffic to your website.
- Adjust landing pages to improve user experience and conversion rates.
- Invest in Pinterest Ads for pins that already perform well organically.
6. Adapt Strategy Based on Trends and Insights
Pinterest’s Trends feature allows you to track emerging topics and interests. Use this tool to:
- Experiment with new content types that align with what’s currently popular.
- Align your content strategy with seasonal trends and high-interest topics.
- Stay ahead of competitors by creating pins based on trending searches.
By continuously monitoring and refining your approach with Pinterest Analytics, you can develop a data-driven Pinterest marketing strategy that maximizes engagement, drives traffic, and improves conversion rates.

