How Agencies Can Prove Organic & Paid Social Media ROI to Clients
 Marion
30 June 2026
Marion
30 June 2026 
Every agency knows the moment: the monthly check-in, the client squinting at a spreadsheet, asking “but what did we actually get from this?“. Proving the ROI of social media, both organic and paid, is one of the most persistent pain points in agency-client relationships. Not because the results aren’t there, but because showing them clearly, in context, in a way that non-marketers understand, is genuinely hard.
This guide walks you through the frameworks, metrics, and tools that help agencies make the case, and keep clients confident between campaigns.
Likes Don’t Pay Retainers
Clients have grown more sophisticated. A decade ago, reach and follower counts were enough to justify a retainer. Today, even mid-sized businesses have a basic understanding that vanity metrics don’t pay salaries. The ROI conversation has shifted, and agencies that haven’t shifted with it are losing accounts.
The problem isn’t that social media lacks measurable impact. It’s that agencies often present data in platform silos– Instagram analytics here, Meta Ads Manager there, a LinkedIn PDF somewhere else, with no unified narrative. Clients end up piecing things together themselves, and they inevitably ask the question you didn’t want them to ask.
The fix isn’t more data. It’s better storytelling with the right data.
Start With the Right Metrics for Each Goal
Before you can prove ROI, you need to agree with the client on what success looks like. This sounds obvious, but it’s skipped more often than not. A campaign aimed at brand awareness has a completely different success metric than one designed to drive direct conversions.
For organic social:
| Reach and impressions | useful for awareness-stage campaigns, but only meaningful when tied to a target audience |
| Engagement rate | a stronger signal of content relevance than raw reach; use it to show what resonates |
| Profile visits and link clicks | proxy metrics for interest and intent |
| Follower growth rate | context-dependent, but relevant for new brands or product launches |
| Share of voice | harder to measure but powerful for brand positioning conversations |
For paid social:
| Cost per click (CPC) and cost per thousand impressions (CPM) | benchmarks for media efficiency |
| Click-through rate (CTR) | indicates ad relevance and creative effectiveness |
| Cost per lead (CPL) or cost per acquisition (CPA) | the metrics clients actually care about |
| Return on ad spend (ROAS) | the clearest way to speak the language of business results |
| Frequency | important for diagnosing ad fatigue before it tanks performance |
The key is to agree on 3–5 primary KPIs per campaign before it launches. Everything else is context.
Build a Reporting Structure
Data without narrative is just noise. When you present results, you’re not delivering a report, you’re making an argument. Structure your reporting like this:
- Campaign objective → What were we trying to do?
Restate it clearly at the top. This anchors everything that follows and keeps the conversation focused.
- What we did → The activity
Content posted, ads run, budget spent. Brief, factual.
- What happened → The numbers
Lead with the metrics that map directly to the objective. Put supporting metrics in context.
- What it means → The interpretation
This is where most agencies fail. Don’t leave clients to draw their own conclusions. Tell them explicitly: “The CPL dropped 22% vs. the previous period because we shifted budget toward the audience segment that had been over-performing.” That sentence is worth more than a bar chart.
- What’s next → The recommendation
Close with a clear action. It keeps the client in forward motion rather than picking apart the past.
The Multi-Channel Problem (and How to Solve It)
Modern campaigns don’t live on one platform. A product launch might include Meta Ads, TikTok Ads, and organic Instagram and LinkedIn content simultaneously. When results are good, clients want to know what drove them. When they’re mixed, they really want to know. And if you can’t answer coherently, you look like you don’t have the situation under control.
This is where campaign-level dashboards become a real competitive advantage for agencies.
Metricool’s Campaign Dashboards are built exactly for this scenario. Instead of pulling results from each platform and stitching them together in a spreadsheet before every client call, you create a single dashboard per campaign, organic posts and paid placements together, and manage everything from one place.
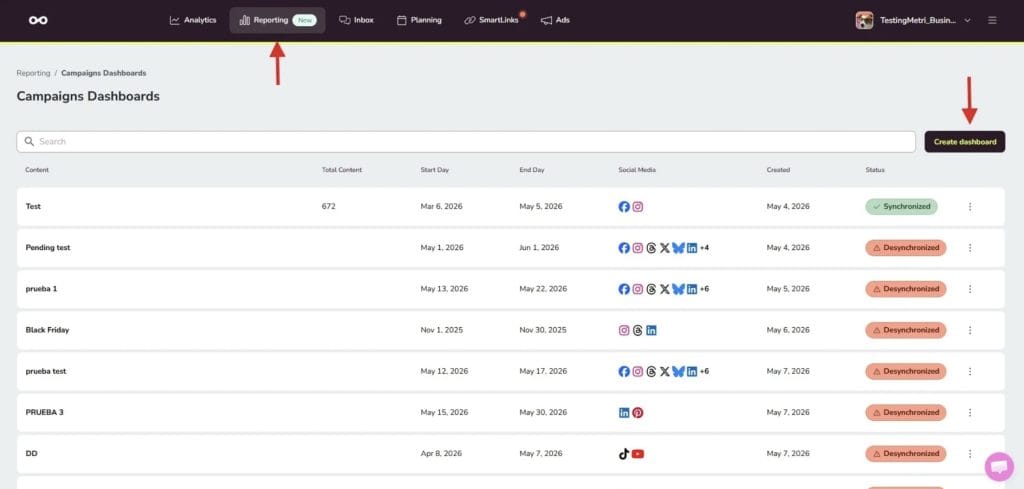
The workflow is straightforward: you name your campaign and write a short description (which also appears in the client-facing view, so write it as context for them), select the relevant social networks and ad platforms, define the date range (up to 90 days), and Metricool automatically suggests posts that match your campaign based on what you’ve named it. You review, adjust the selection, and sync.
Once synced, the dashboard pulls together a content summary, identifies the top 5 performing posts, and, if you have at least 10 pieces of content, generates AI Insights that break down performance by network and by ad platform, surface patterns in what’s working, and flag optimization opportunities. The narrative format of these insights is particularly useful for client-facing reporting: it’s analysis rather than a raw data dump.
Presenting Reports that LookLike Yours
One of the least-discussed costs in agency life is reporting time. Building a client deck the night before a check-in, manually exporting CSVs, reformatting everything to look consistent… it’s hours per client per month that could be spent on actual strategy .
Campaign Dashboards address this directly. Once your dashboard is built and synced, sharing it is one click: you generate a shareable public link and send it. The client gets a read-only live view (no Metricool account required on their end) and the link always reflects the latest sync.
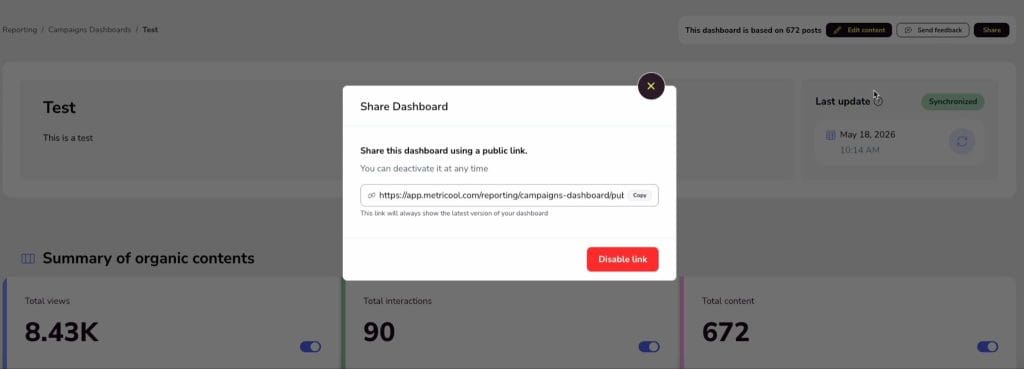
You can also white-label the dashboard with your agency’s logo, which goes a long way in reinforcing your brand and making the report feel like a deliverable rather than a tool export. The logo is set once per brand in the dashboard settings.
For agencies managing multiple clients, this scales without extra complexity. Each brand in Metricool has its own set of dashboards, its own permissions structure, and its own logo settings. Team members can be assigned full access or view-only depending on their role, which keeps sensitive client data appropriately siloed.
See what a branded Campaign Dashboard looks like in practice 🔎
Connecting Organic and Paid Performance in the Same View
Beyond operational efficiency, the real value for agencies is showing clients how organic and paid work together. This is a conversation that’s increasingly relevant as platform algorithms reward brands that show up consistently across formats.
When you include both organic posts and paid campaign data in a single Campaign Dashboard, you can surface things like:
- Which organic content drove enough engagement to be worth amplifying with paid
- Whether your ad creative is outperforming or underperforming compared to organic content on the same theme
- How paid reach is complementing organic reach across the campaign period
These are strategic insights, not just reporting data. They position your agency as the one that understands the full picture, not just the media buyer or just the content team.
Practical Tips for the Reporting Conversation
- Set expectations at the campaign kickoff, not the review. Agree on KPIs, agree on what “good” looks like, and document it. When the review comes, you’re measuring against a shared standard.
- Use the top 5 posts view as a conversation starter. In Metricool’s Campaign Dashboard, you can toggle the ranking between impressions and interactions. In a brand awareness campaign, lead with impressions. In an engagement-focused campaign, lead with interactions. Match the story to the objective.
- Let AI Insights do the first draft. The automated analysis that Campaign Dashboards generate after syncing is a strong starting point for the narrative you’ll bring to the client call. It’s pattern recognition at scale, use it, then add your own strategic layer on top.
- Be specific about what you’re changing. Vague plans erode client confidence. “We’re going to test new creative” is weak. “We’re doubling down on the short-form video format that drove 3× the engagement of static posts this month, and testing two new hooks targeting a slightly younger segment” is a strategy.
- Sync before every client touchpoint. It sounds simple, but stale data in a client meeting is avoidable and looks careless. Build the sync into your pre-call checklist.
The main takeaway is to think relationship, not just report. The agencies that retain clients longest are the ones clients trust most, not necessarily the ones with the best results each month. And trust isn’t built by one impressive number; but by showing up with clarity, month after month.
Get the system right, and the conversation changes. Clients stop questioning the value of social media and start asking where to invest more.
