

How to Create a Social Media Campaign Dashboard with Metricool
 Kata
26 May 2026
Kata
26 May 2026 
The campaign ends and your client reaches out to know the results.
Suddenly a whirlwind hits and you turn into Taz from Looney Tunes. You open Instagram, then TikTok, then Meta Ads, dig up last week’s spreadsheet to look for the right metrics, copy screenshots… and by the time you finally have something to send, you’ve spent two hours spinning around something that should’ve been ready in just ten minutes.
Measuring a social media campaign seems easy, but only until you actually have to pull all the data together. And that’s exactly the social media campaign measurement problem most marketers face.
If this sounds like a day in your life, it’s not necessarily your organizational skills that abandoned you; it might just be a tools issue. Metricool’s Campaign Dashboards are designed exactly for this. They bring all the content from a campaign together in one place – organic and paid, across all your social platforms – and analyse everything as a whole. No more spinning, just quick answers in one dashboard.
What Is a Social Media Campaign Dashboard?
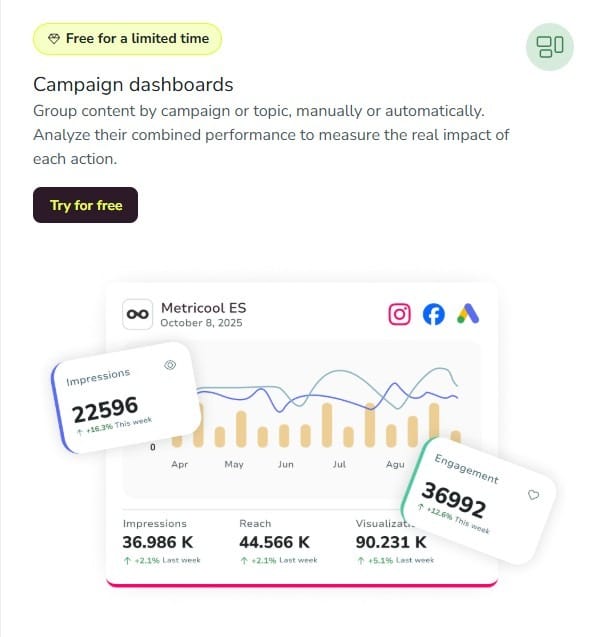
A social media campaign dashboard is a panel that brings together all the data from a specific campaign so you can analyse its performance as a whole. Unlike a general social media report, which shows overall brand performance over a given time period, a campaign dashboard focuses on one specific action: a product launch, a promotion, a seasonal campaign, a collaboration, an event, or a paid media campaign.
With Metricool, Campaign Dashboards bring together organic posts, content from different social platforms, and paid campaigns in a single view. This way you separate the results of a specific campaign from the brand’s regular activity and understand its performance without reviewing each channel separately.
This feature helps you answer questions like:
- Which posts performed best
- Which social network delivered the best results
- Which ads performed best
- Which content is worth repeating or adapting
- What conclusions you can draw for the next campaign
And you can share those results clearly with your client or team without having to build a report from scratch.
Who Is This Tool For?
Campaign Dashboards are designed for marketers, agencies, social media managers, and teams that need to track campaigns across multiple social networks without getting lost in scattered data.
It’s especially useful if you manage multichannel campaigns, combine organic content and paid media, prepare reports for clients or marketing managers, and want to know what worked so you can improve future campaigns.
When to Use Campaign Dashboards vs. Other Metricool Tools
Metricool has several ways to analyse and present data, but they don’t all serve the same purpose. The key is knowing what you want to measure.
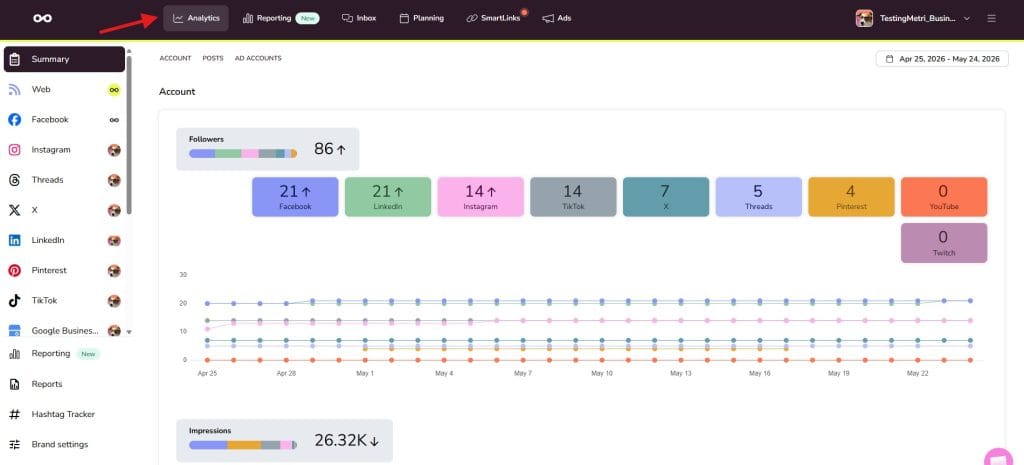
- Analytics is for reviewing day-to-day performance: the growth trajectory of your accounts, which posts are performing best, and how your content is doing on each social network you connected with Metricool.
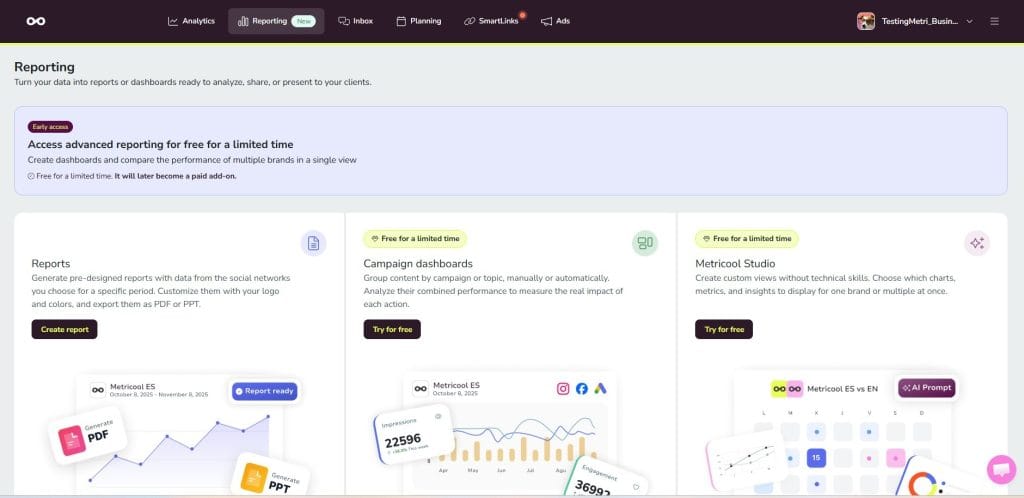
- Reports is the option for creating periodic brand reports, such as monthly reports for clients or teams that show the overall performance of an account over a specific time period.
- Campaign Dashboards is the specific option when you want to analyse a particular action without mixing it with the rest of your posts. For example: a launch, a one-off promotion, a seasonal campaign, an influencer activation, event coverage, or a campaign combining organic posts and ads.
- Metricool Studio helps when you need more personalised AI-driven analysis: write a prompt, compare results across brands or time periods, and generate visualisations tailored to your analysis.
- Looker Studio, via Metricool’s connector, is a more advanced option for building custom dashboards, combining data from different sources, and creating reports with a higher level of personalisation.
How Others Are Using Campaign Dashboards
Campaign Dashboards work differently depending on the type of campaign or project you’re managing. Here are the most common use cases:
- Client reporting: If you manage several brands, each brand gets its own dashboard. When the monthly review comes around, you just open the dashboard and share it directly with each client, without exporting anything.
- Launches: A new feature, a new collection, the announcement of a physical or digital product. Weeks of content spread across different networks, all in the same dashboard. A few examples you can adapt to your own case:
- By product type: Let’s assume your brand is a bookstore with different categories (books, comics, stationery, etc.), build a dashboard for each product type and see which one generates the most interest.
- By content type. Imagine your brand is an agency or B2B consultancy that publishes across several editorial pillars. A dashboard for each one shows you which type of content connects best with your audience: case studies, educational content, interviews, or industry trends.
- By new feature or service. When you announce a new feature or service, build a dashboard with all the related posts to see how the launch performed.
- Time-bound campaigns: Black Friday, seasonal sales, back to school. A start date and an end date + all the data in one place. Some dashboard examples: Black Friday 2026, posts riding a new trend, flash sales or limited-time offers.
If you’re working on any of these campaigns, let’s see how you can create a campaign dashboard in Metricool.
How to Create a Campaign Dashboard in Metricool
You can create a social media campaign dashboard from the Reporting tab of Metricool and select which content belongs to each campaign.
Before you start, note that this feature is free only for a limited time, after which it will become a paid add-on for Starter or Advanced plans.
1. Create the campaign dashboard
Go to the Reporting tab, select Campaign Dashboards and hit “Create dashboard”.
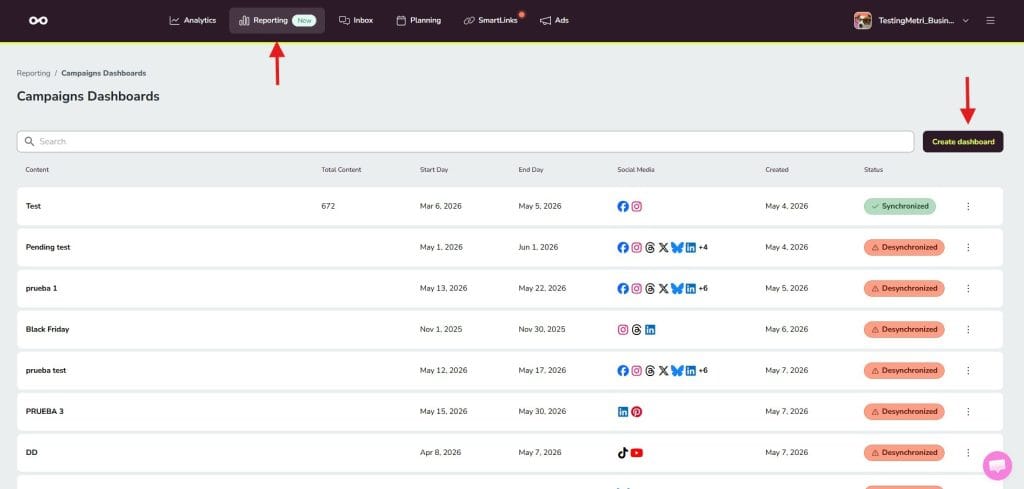
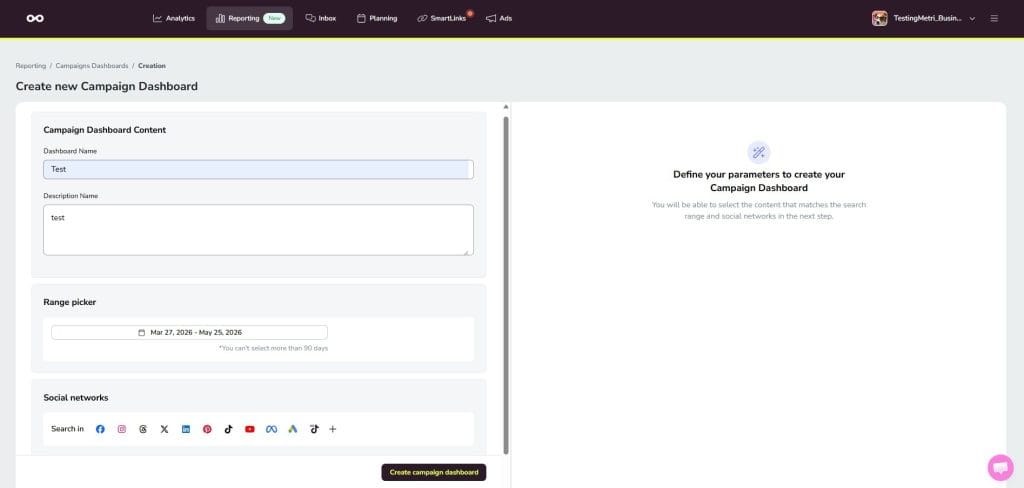
Then fill in these fields:
- Dashboard name. For example: “Black Friday 2025 Instagram and Meta Ads”
- Description
- Date range (maximum 90 days)
- Social networks and ad platforms you want to include
Here’s a trick: if you put something specific in the description, for example “Black Friday 2026 campaign”, the dashboard picks up on those keywords and automatically pulls in the posts that contain them. You don’t have to add content one by one.
Keep in mind that the dashboard’s name and description will be visible if you choose to share it via a link, so use this space to give the necessary context about your campaign.
2. Select the campaign content
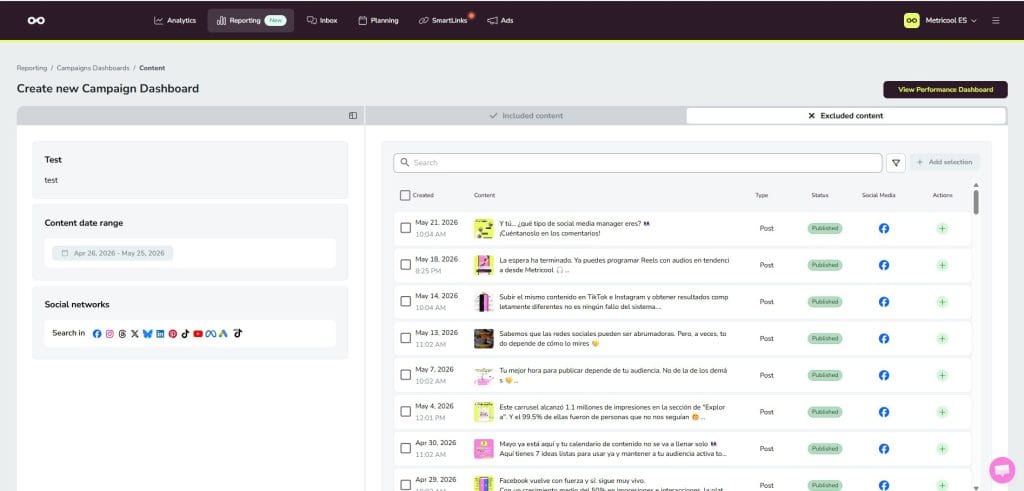
Once the dashboard is created, Metricool helps you review which posts can be part of the campaign.
The tool automatically suggests relevant posts based on the campaign name and description. You then decide which content to add or exclude (“Included content” and “Excluded content” tabs). Select the posts you want to include under the “Exclude content” tab and then tap “+ Add selection”.
You can also use the search and filters to find specific posts.
3. Add posts from the planner or from analytics
You don’t have to add all content from the dashboard alone.
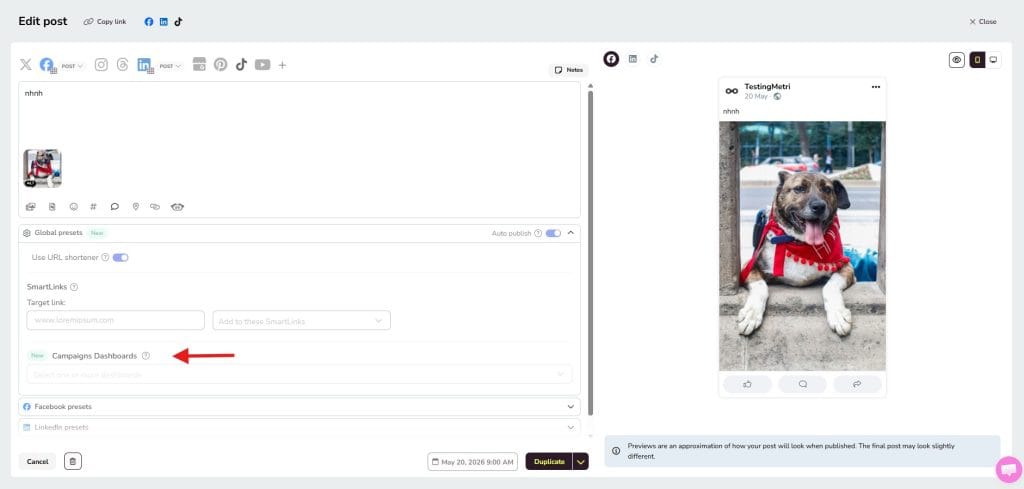
If you’re scheduling a post in Metricool, you can link it to one or more campaign dashboards directly from the planner. The dashboard must be created before scheduling that post. You can also add posts from Analytics by going to the post list for each social network.
Once a scheduled post is published, its analytics are automatically assigned to the matching dashboards based on the networks you configured; no manual update needed.
4. Analyse the campaign results
Once you’ve added the content to the dashboard, the exciting part begins: reviewing what happened during the campaign.
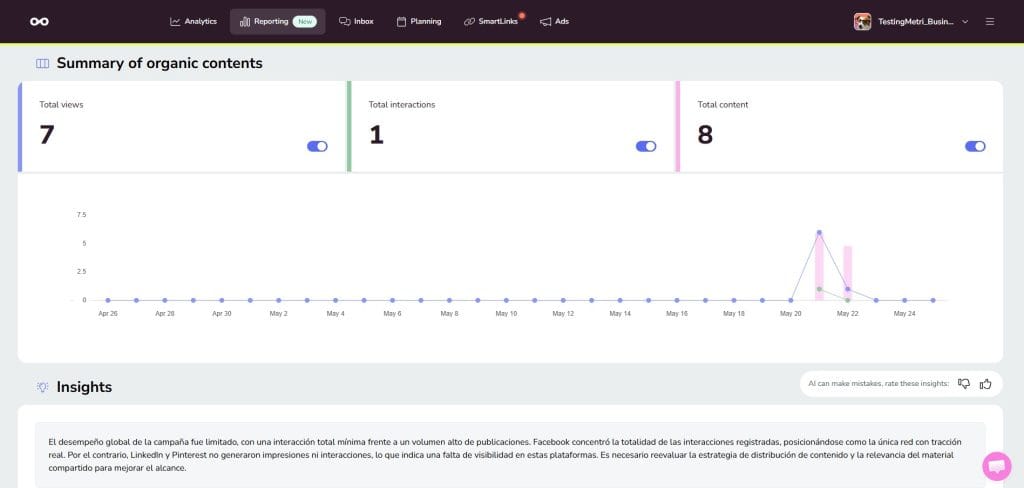
In this view you can see a summary of the most important social media metrics – views or impressions, interactions, and engagement. The dashboard also breaks down more specific data, such as detailed interactions (likes, comments, saves, and other actions depending on the social platform). For paid campaigns, you can also see spend, CPC, and CTR alongside your organic metrics, all in the same view. This gives you full social media campaign analytics in one place without having to switch between tools.
You can also see the campaign’s evolution through charts – views and interactions by post type, for example – to understand not just how much impact the campaign had but which formats delivered the best results.
Metricool also shows you the top-performing posts that you can sort by views or impressions depending on your goal.
If the dashboard has at least 10 posts, you can also use the AI Insights section. It summarises overall performance, identifies patterns, highlights what top-performing content has in common, and offers recommendations to help you interpret the data with more context.
5. Share the dashboard with your client or team
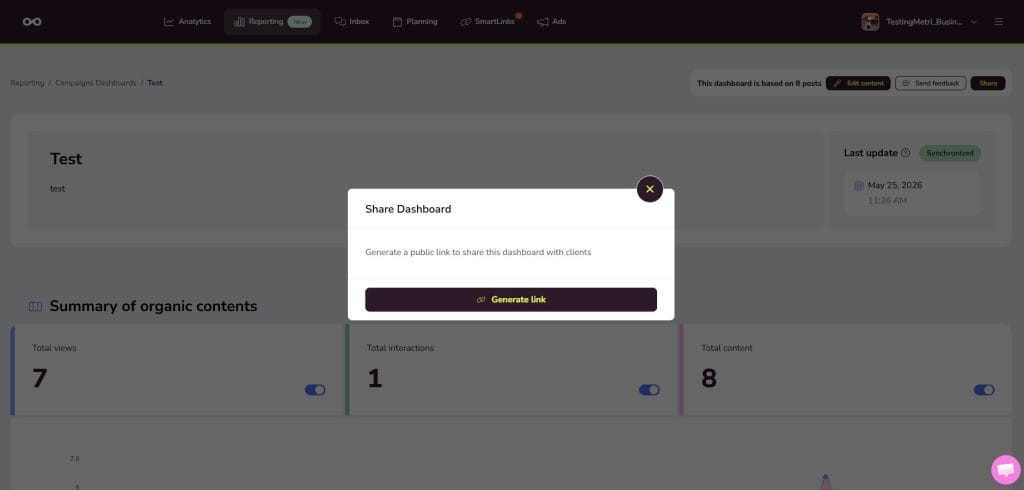
Once your dashboard is ready, click “Share” and copy the link. This gives anyone you share it with a real-time view of the dashboard. This is what turns your dashboard into a ready-to-share social media campaign report in seconds.
When giving team members access, choose between two permission levels: Full access (create, edit, delete, view analytics) and View only (see metrics and assign posts from the planner). Pick whichever fits each person’s role.
Before sending, check that the content is correct, the data is up to date, and the description gives enough context to understand the campaign.
Tips for Creating a Campaign Dashboard with Metricool
To get the most out of this feature, keep these tips in mind:
- Use a clear, specific campaign name: It helps you identify each dashboard quickly, especially when managing several campaigns at once.
- Use the description to provide context: It’s visible when you share via link, and it helps Metricool surface relevant posts automatically.
- Only select the networks and platforms that are part of the campaign: This keeps results clean and avoids mixing in unrelated data.
- Review carefully which posts, videos, or ads you include: The value of the dashboard depends on the selected content accurately representing the campaign.
- Include at least 10 posts for AI Insights: Below that threshold, the feature won’t activate.
- Use insights as a starting point, not a final verdict. Metricool helps you read the data, but your own campaign context – objective, investment, strategy changes – completes the picture.
Benefits of Using Metricool’s Campaign Dashboard
You’ve seen how it works, here’s what you’ll get out of it:
You analyse the full campaign, not individual posts
A post can perform very well on its own without the entire campaign being a success. With a dashboard you can see the overall performance and understand how each piece of content contributed to the final result.
You know which posts performed best
Metricool shows the top 5 posts in this campaign report – a clear signal for future campaigns. This makes it easy to quickly identify which content stood out and which formats you can adapt for your next actions.
AI-generated insights
Beyond the metrics, campaign dashboards include AI insights to help you interpret the results. These insights summarise overall performance, identify patterns, highlight relevant posts, and offer recommendations so the analysis doesn’t stop at numbers.
You analyse organic and paid, side by side
If your campaign combines organic posts and ads, analysing each part separately takes more time and can leave you with an incomplete picture. With this tool you review organic and paid performance, including spend, CPC, and CTR, in a single view to better understand what each action contributed. This helps you refine your strategy for future campaigns.
Shareable in one click
When the dashboard is ready, share it with clients, managers, or team members via a public URL. With two permission levels (Full access and View only) you can control exactly what each person can see and do. No screenshots, no spreadsheets, no unnecessary steps: one click and everyone has access.
So when the question “what worked in this campaign?” comes up next, you’ll know exactly how to answer, and it won’t take two hours. Just seconds.
Ready to stop spinning and start analysing?
Your next campaign dashboard is one click away.
FAQ
How is this different from Metricool’s regular reports?
Reports are designed for periodic brand reporting (monthly, quarterly). Campaign Dashboards are specifically for analysing concrete campaigns with a start and end date (maximum 90 days), grouping the organic and paid content from that particular action.
Can I add both organic content and paid ads to the same dashboard?
Yes. Campaign Dashboards combines organic posts and paid campaigns from any social network in a single analysis.
Can I use campaign dashboards on mobile?
Not yet. It’s currently desktop only. From the mobile app you can only view reports.
Are the AI Insights generated automatically?
Yes, as long as you include at least 10 posts.
What permission levels are available when sharing?
Two: Full access (create, edit, delete, view analytics) and View only (see metrics and assign posts from the planner). Pick whichever fits each person’s role.
