What Is Metricool Studio? The AI Reporting Tool That Builds Your Social Media Reports for You
 Gretchen Oestreicher
22 May 2026
Gretchen Oestreicher
22 May 2026 
If you’ve ever spent a Friday afternoon piecing together a client report, pulling numbers from Instagram, copying TikTok screenshots into a slide deck, and writing the same “engagement was up this month” intro you wrote last month, Metricool Studio was built for you.
Metricool Studio is an AI-powered reporting feature inside Metricool that turns your social media data into complete views: charts, tables, and written insights, all generated from a single prompt. Instead of building reports by hand, you describe what you want, and Studio delivers it.
This guide covers what Metricool Studio does, how to use it, the prompts worth trying first, and how it compares to Campaign Dashboards so you know which to reach for.
What Metricool Studio Does Differently From Traditional Reporting
Metricool Studio lives in the Reporting section of Metricool, alongside Standard Reports, Campaign Dashboards, and the Looker Studio connector. It’s an AI layer that analyzes your connected social profiles and creates ready-to-share views without you touching a chart builder.
Three things set Metricool Studio apart from traditional reports:
It interprets your data. Standard reports give you the numbers. Studio gives you the numbers plus a written interpretation of what changed, why it matters, and what to do next. It generates executive summaries, conclusions, and content recommendations based on your top-performing posts.
It handles comparisons that standard reports can’t. Want to compare February of this year to February of last year? Stack Brand A against Brand B against a competitor? Look at three networks side by side? Studio handles multi-brand, multi-network, multi-period analysis in a single view, with no manual stitching required.
It works in plain language. There’s no template configuration and no chart-by-chart setup. You describe the report you want (something like “show me my top-performing reels from the last two months and suggest five new ideas”), and Studio builds it.
Here’s how Metricool’s four reporting options compare:
| Standard Reports | Analytics | Looker Studio | Metricool Studio | |
|---|---|---|---|---|
| Customization | Limited (logo, colors) | No | Full | Full |
| Multi-brand & comparisons | No | No | Yes | Yes |
| Works inside Metricool | Yes | Yes | No | Yes |
| AI insights & recommendations | No | No | No | Yes |
How to Use Metricool Studio
Going from “I need a report” to a finished view takes a few minutes.
Here’s the full workflow.
Step 1: Open Metricool Studio
Log in to Metricool, go to Reporting in the top menu, and click Metricool Studio. Then click Create new view.
Step 2: Choose Guided or Expert Mode
Studio offers two ways to build a view:
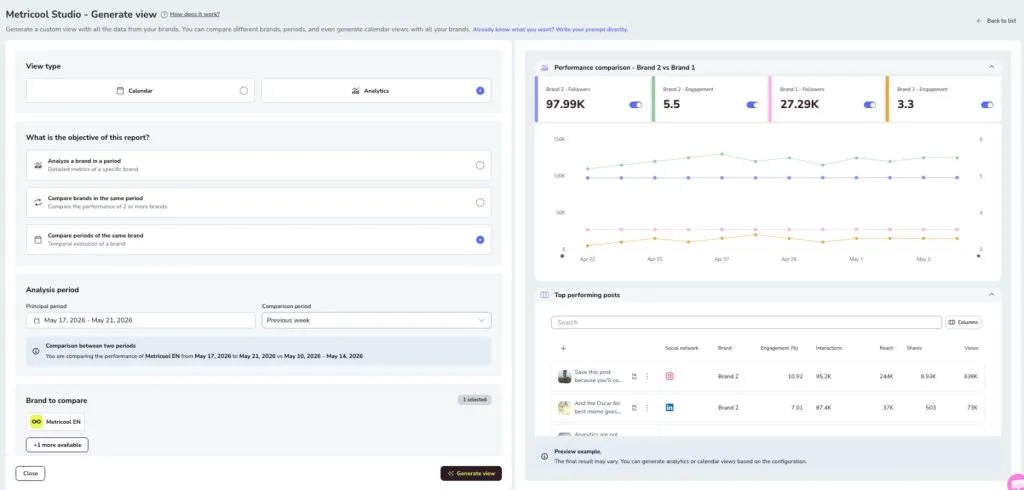
Guided mode walks you through structured fields like view type, period, brands, networks, and metrics, then builds the prompt for you. This is the right starting point the first time around, or any time you want a clean base to edit.
Expert mode gives you a free-text input. Write your prompt directly, or start from a Smart template (competitor analysis, best posting times, content ideas, and more). This is the faster path once you know what you want.
A useful trick: even if you prefer Expert mode, start in Guided mode and click Show generated prompt. You’ll get a well-structured prompt you can edit instead of writing one from scratch.
Step 3: Pick a View Type
Studio creates two kinds of views:
- Calendar views show scheduled posts across brands and networks for a specific time period. Ideal for content planning and weekly client check-ins.
- Analytics views show performance metrics and AI-generated insights. Ideal for monthly reports, brand comparisons, and post-campaign analysis.
For Analytics views, you’ll also pick an objective: analyze one brand, compare brands, or compare periods of the same brand. The maximum analysis period in Guided mode is three months.
Step 4: Generate and Review
Click Generate view. Studio runs the analysis in the background, so you can keep working or close the tab. The bell icon in the top menu tells you when it’s ready. When it’s done, you’ll get a combination of line charts, bar charts, pie charts, tables, and written insights, all chosen by Studio based on your prompt.
Step 5: Manage and Share
Every view lives in your Studio dashboard with its name, type, analyzed period, brands, and last update. From the three-dot menu, you can rename it for clarity, duplicate it to reuse the structure for a new brand or period, or remove it.
To share, click the share icon and generate a public read-only link. Send it to your client. They don’t need a Metricool account to open it. If the view uses a relative period like “this week” or “this month,” the same link refreshes automatically, so there’s no need to resend it every week.
Top Tips for Getting the Most Out of Metricool Studio
A few habits will make Metricool Studio much more useful day to day:
Be specific across five dimensions. Every prompt should ideally cover brand(s), networks, time period, metrics, and visualization type. The more of these you define, the closer the output matches what you had in mind. Leave any of them vague, and Studio will make assumptions.
Use relative periods for recurring reports. “Feb 1-28, 2026” works for a one-off. “This month” is what you want for a client report you’ll refresh every few weeks: same URL, fresh data.
Duplicate instead of rebuilding. Found a view that works? Duplicate it and swap the brand or period. It takes seconds, keeps your reporting consistent, and avoids the small variations that come from re-prompting from scratch.
Test in Analytics first. If you’re unsure whether a metric is available, check Metricool Analytics. If the data exists there, Studio can use it, and combine it in ways Analytics on its own can’t.
Write your prompt in the language you want the output in. Studio detects language from your prompt. Write in Spanish, get a Spanish report. Write in English, get English. Metric labels in charts may occasionally stay in their original language, but introductions and insights translate reliably.
Know what Studio can do. Metricool Studio analyzes data Metricool already collects from your connected profiles. It can’t pull from Google Analytics, your CRM, or any other external source. For that, use the Looker Studio connector. One specific caveat for competitor analysis: follower counts are stored as a cumulative snapshot, so Studio can’t show competitor follower evolution over time, but every other competitor metric is fair game.
Prompts to Ask Metricool Studio
The fastest way to understand what Metricool Studio can do is to see real prompts. Here are six worth trying. Adapt them to your own brands and networks.
1. Monthly Performance Recap for One Brand
“Analyze Brand A’s Instagram and TikTok performance from the last 30 days. Include follower growth, reach, engagement rate, and a table with the top 10 posts by interactions. End with a written summary and recommendations for next month.”
2. Brand vs. Competitor Comparison
“Compare Brand A and Competitor B on Instagram for the last 180 days. Show engagement rate, average reach per post, and posting frequency side by side. Highlight what Competitor B is doing differently.”
3. Year-Over-Year Period Comparison
“Compare Brand A’s LinkedIn performance in February 2026 against February 2025. Show follower growth, impressions, and top-performing post formats for each period.”
4. Content Ideas Based on Top Performers
“Pull all reels from January and February 2026 from Brand A’s Instagram, ranked by views and reach. Based on the top 5, suggest 5 new reel ideas to publish in the next month.”
5. Best Time to Post Analysis
“Analyze when Brand A’s Instagram posts get the highest engagement. Based on the data from the last 3 months, recommend the best days and times to publish.”
6. Weekly Content Calendar for a Client
“Generate a Calendar view with all scheduled content for Brand A and Brand B across Instagram, TikTok, and LinkedIn for the coming week.”
For more starting points, open Expert mode and click ✨ Smart templates. Metricool ships pre-built templates for competitor analysis, posting times, content ideas, multi-period comparisons, and more.
Metricool Studio vs. Campaign Dashboards
Both tools live in the Reporting section, both generate AI insights, and both produce shareable reports. So when do you reach for which?
Use Campaign Dashboards when you’re measuring a specific activation. Campaign Dashboards is built for grouping organic posts and paid ads under a single campaign and reporting on them as a unit. You assign content (Metricool even suggests posts automatically based on your campaign name and description), and you get a content summary with a chart, your Top 5 posts ranked by impressions or interactions, and editable AI Insights. It’s the right tool for launch reports, seasonal campaigns, and any activation that spans multiple channels and post types.
Use Metricool Studio when you need flexibility. Studio doesn’t care about campaign boundaries. It analyzes whatever you ask: brand vs. brand, period vs. period, format vs. format, competitor benchmarking, content idea generation, calendar views. It handles questions Campaign Dashboards isn’t designed for.
The simple rule: a defined campaign goes to Campaign Dashboards. An open-ended question about your social data goes to Metricool Studio.
A few practical differences worth knowing:
- Each Campaign Dashboard belongs to a single brand. Studio can mix brands in one view.
- Campaign Dashboards cap at 180 days. Studio’s Guided mode caps at 3 months, with more flexibility in Expert mode.
- Campaign Dashboards needs at least 10 posts to generate AI Insights. Studio works with any data range that has content.
Many agencies use both: Campaign Dashboards for client activations, Metricool Studio for monthly reports, competitor research, and ad-hoc questions.
Where Studio Fits in Your Week
Most of what makes social media reporting tedious is the assembly: pulling numbers from each platform, formatting them, and writing the same intro every month. Metricool Studio handles that part and leaves you with the work that actually needs your judgment, which is what the data means and what to do next.
The first view is always the slowest, because you’re figuring out how to phrase what you want. After that, the pattern gets easier: duplicate what works, tweak the period or the brand, and share the link. Reporting stops feeling like the chore that eats your Friday afternoon and becomes something you can knock out between meetings.
Try Metricool Studio
Turn a single prompt into a complete social media report with charts, tables, and AI insights.
