

Social Media Advertising Trends 2026: What the Meta and TikTok Data Shows
 Gretchen Oestreicher
22 September 2026
Gretchen Oestreicher
22 September 2026 
The social media advertising trends for 2026 come out of 44,355 advertisers, 628,969 Meta and TikTok campaigns, and more than $471 million in ad spend. That’s the data behind the questions most advertisers are asking right now: where traffic comes cheaper, which platform brings in leads for less, and what’s happening to return on investment. The numbers point to some clear changes in how budget moves between Meta and TikTok.
Social Media Advertising Trends for 2026
Here’s how spend divides between the two platforms, which objectives pull the most budget, and where the best results are showing up.
1. Meta’s Still the First Choice, but TikTok Is Gaining Ground
When it comes to where brands advertise, Meta is still well ahead. 91% of the advertisers we analyzed run ads on Meta alone, compared with 5% who bet only on TikTok and 4% who use both.
Meta stays the default for social advertising, and its ads platform is where most campaigns still get built.
The budget split, though, moves in TikTok’s favor. Among accounts that use both platforms, TikTok picks up a bigger share, from 23.6% of combined spend in 2025 to 25.7% in 2026. Meta still takes most of it, but its share slips from 76.4% to 74.3%.
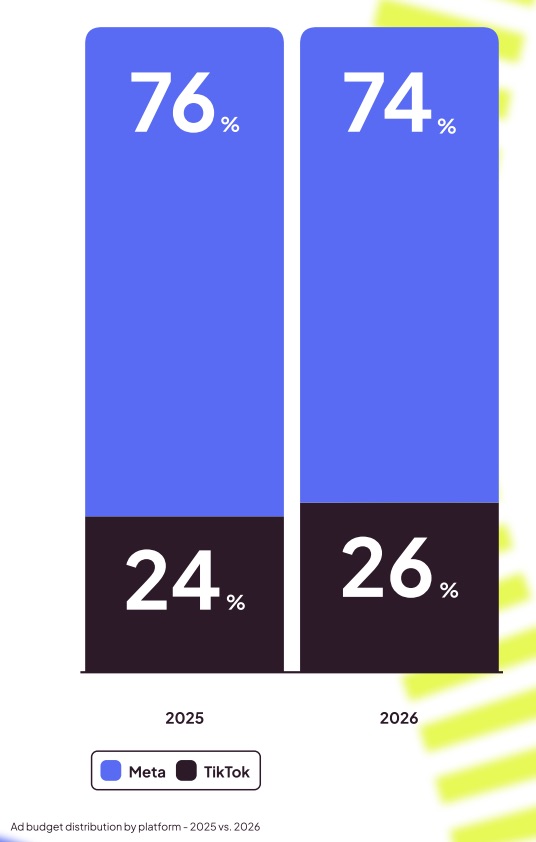
That gap narrows most among small accounts. For Tiny advertisers (under $100 a month) running both platforms, TikTok now takes 44% of the budget against Meta’s 56%.
For these advertisers, TikTok is no longer the channel you hand a small test budget and forget. It’s starting to carry weight much closer to Meta’s.
2. Spend per Campaign Is Growing Much Faster on Meta
Advertisers are putting more money behind each campaign, and the jump is far bigger on Meta. Average spend per Meta campaign climbed 47%, from $489.53 in 2025 to $718.45 in 2026. TikTok rose too, but only about 4%, from $1,262.10 to $1,308.97.
Higher spend isn’t buying the same lift in results, though. On Meta, part of that increase just covers higher costs: reaching a thousand people went from $1.97 to $2.64, while TikTok’s barely moved. What each dollar returns is a separate question from how many dollars you put behind a campaign.
3. TikTok Costs Less for Visibility
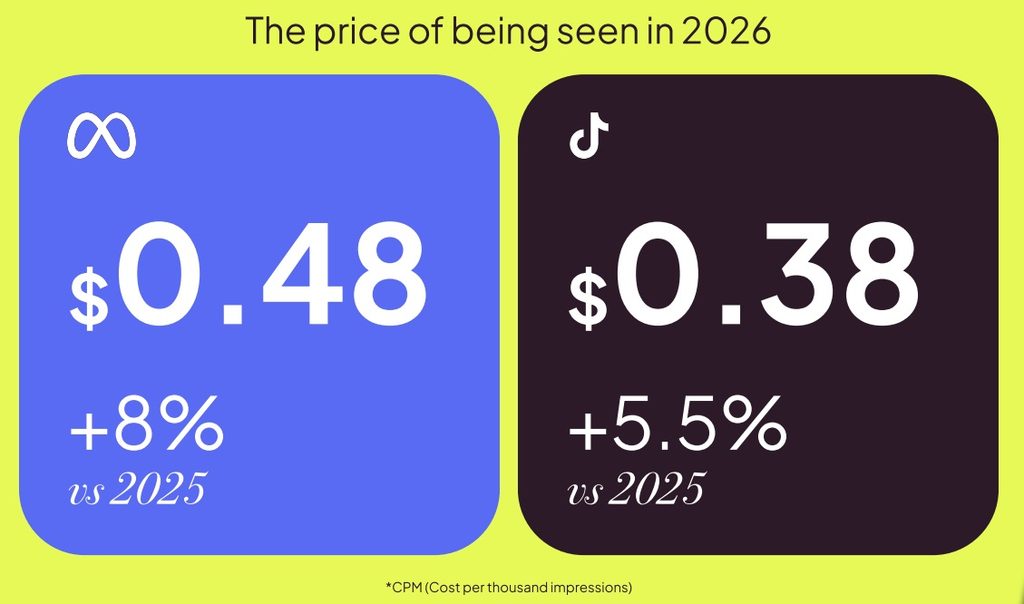
If your goal is getting more people to see your brand, TikTok has the edge. Its CPM (cost per thousand impressions) comes in 22% lower than Meta’s, $0.38 against $0.48.
Advertisers also put more into TikTok reach campaigns on average, $853.15 versus $493.65 on Meta. They get more than twice the impressions back, a little over 2.2 million against roughly 1 million.
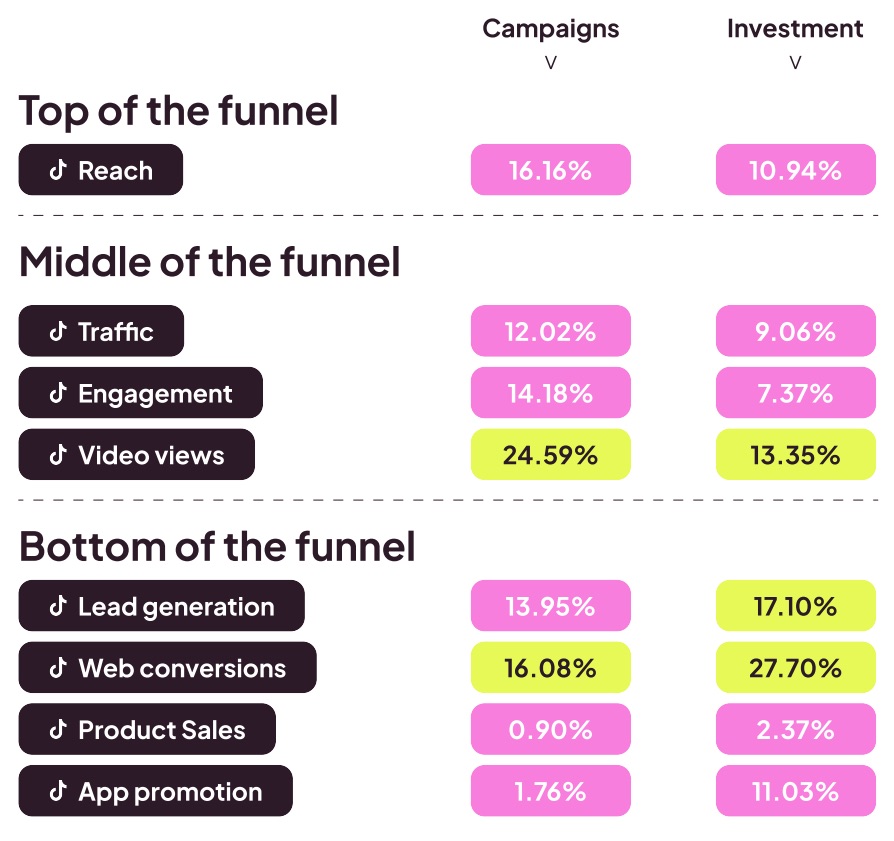
You can see the same priority in the budget split. Brands route 10.94% of their TikTok spend into reach, almost double the 5.82% they give to awareness on Meta.
4. Traffic Costs Less on TikTok Too
The gap widens in the middle of the funnel. Average CPC is $0.07 on Meta against $0.03 on TikTok, and the clicks follow. A traffic campaign averages 4,594 clicks on Meta and 35,493 on TikTok, close to eight times as many, though TikTok also starts from a bigger budget ($949.83 against $304.03).
If you’re sending people to a site, a landing page, or a piece of content, TikTok earns a place in the plan.
5. Meta Gets More Out of Engagement Campaigns
When the goal is interaction rather than clicks, Meta takes the lead. Engagement comes in at 2.15% on Meta and 1.99% on TikTok.
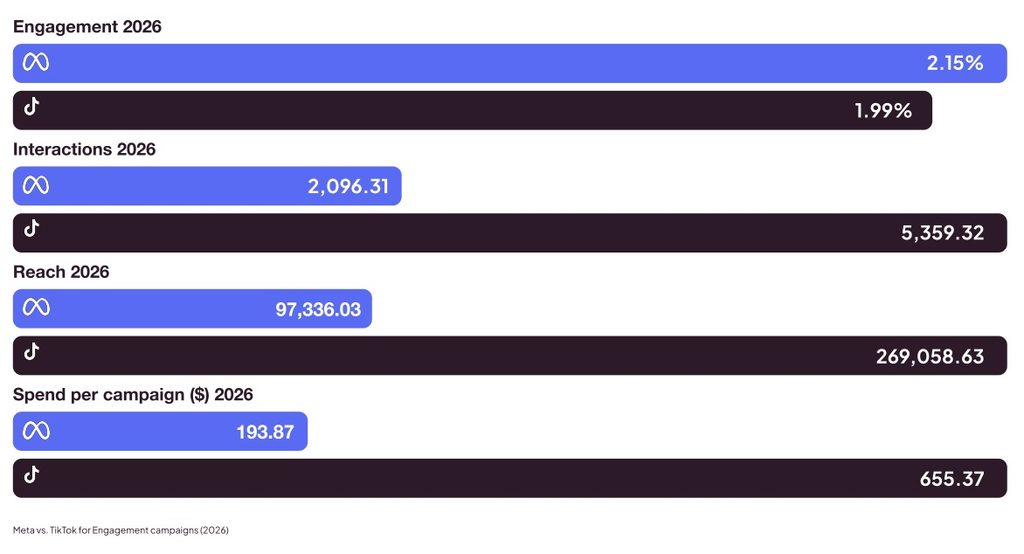
TikTok generates more interactions overall, but it needs a much bigger budget to get them. Once you factor spend in, Meta returns 10.8 interactions per dollar against TikTok’s 8.2.
Which platform performs better depends on the objective. TikTok gets reach and traffic for less, and Meta stretches the budget further when the goal is interaction.
6. TikTok Brings Down the Cost per Lead
Lead generation is where the split gets striking. Spend per campaign is almost identical on both platforms, around $1,550, and the results are far apart. Cost per lead is $6 on Meta against $2.69 on TikTok. On a similar budget, TikTok brings in more than twice the leads, 573.9 against 259.1.
Meta does pull the higher CTR, 2.04% against TikTok’s 0.75%, so a larger share of users click its ads. But TikTok converts more of those clicks into leads, about 6 for every 100 clicks against fewer than 5 on Meta. A strong CTR tells you people clicked, not that they converted, which is why it can read better than the lead numbers sitting behind it.
7. Most of the Budget Sits at the Bottom of the Funnel
On Meta, campaign counts and spending pull in different directions. 67% of campaigns focus on traffic or engagement, yet 70.9% of the budget goes to the bottom of the funnel.
Sales campaigns make the point clearest: they’re just 11.25% of the total but take 42% of the spend.
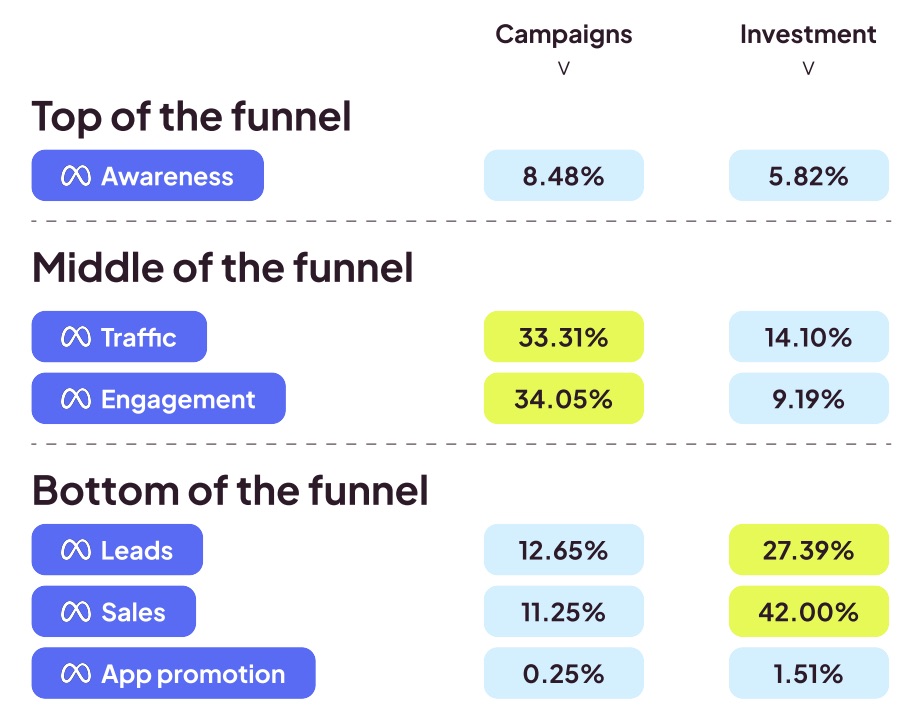
TikTok spreads things a little more evenly, though the same pattern holds, with 58.2% of spend ending up at the bottom of the funnel against 32.7% of campaigns.
Brands run plenty of campaigns to pull in attention, visits, and interaction, and save their biggest budgets for leads, conversions, and sales.
8. Meta’s ROAS Falls Even as Spend Rises
ROAS on Meta Sales campaigns fell from 5.48 in 2025 to 4.57 in 2026. Every dollar spent brought back $5.48 in 2025, and a year later that’s $4.57. It isn’t a spending pullback: analyzed spend went from $62.9 million to $151.8 million, and purchase value rose from $344.8 million to $694.4 million. Revenue just didn’t keep pace with investment, and that’s what pulls ROAS down.
Account size changes the picture too. ROAS drops across every segment, and Huge accounts (over $10K a month), despite the largest budgets, post the lowest return at 3.97 in 2026. A bigger budget is no guarantee that each dollar works harder.
9. TikTok Delivers Sales at a Lower Cost, on Far Fewer Campaigns
In the sales campaigns we looked at, a sale costs far less on TikTok. CPA comes in at $1.14 on TikTok against $11.14 on Meta. TikTok’s campaigns even carry a higher average spend, $3,332.87 against Meta’s $2,681.23, and still hold a much lower cost per conversion.
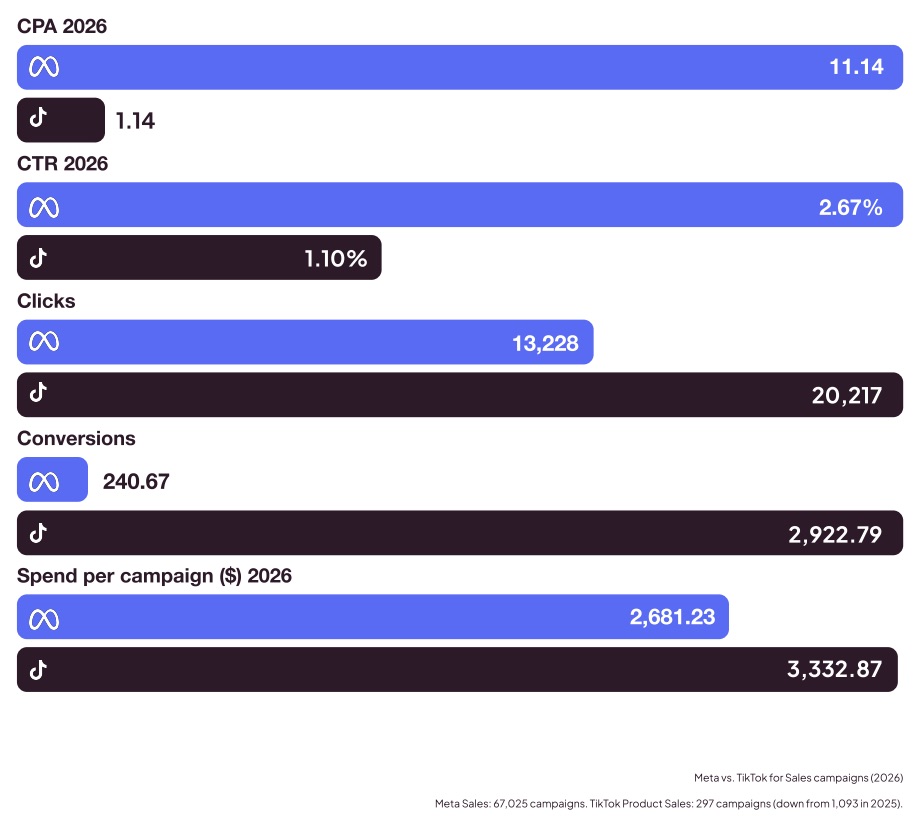
That figure needs reading with care. Meta has 67,025 sales campaigns behind it, while TikTok has just 297 product sales campaigns, down from 1,093 the year before. The accounts still running the objective on TikTok may well be the ones it’s already working for.
Which to Choose: Meta Ads or TikTok Ads in 2026?
No single platform comes out ahead on every objective in this data. Meta stays the base layer of social advertising for most advertisers, and it holds up well on interaction. TikTok is picking up budget and comes in cheaper for visibility, traffic, and leads.
So start from what you want a campaign to achieve and what that goal costs on each platform, then let the Meta-or-TikTok call follow. With budget for both, compare results objective by objective. If you have to choose, back the funnel stage you most need to strengthen and put your spend there.
Compare Your Own Meta and TikTok Results
Everything above is the market average. The number that decides your budget is your own split between the two platforms. Metricool lines up your Meta and TikTok ad results in one dashboard. You can read your CPM, CPC, and cost per lead campaign by campaign, and move spend toward whatever’s paying off.
Read Your Meta and TikTok Ad Analytics Side by Side
Metricool brings both platforms into one dashboard so you can adjust your ad strategy with confidence.
