How to Automate Your Social Media Reports with AI [Claude+Metricool]
 Kata
25 June 2026
Kata
25 June 2026 
If you’re managing social media for multiple clients at your agency, monthly reports are probably the one task you most want off your plate. That day spent copy-pasting numbers, formatting and writing summaries? Gone for good.
Here’s what changes with Metricool’s MCP connection: you connect your Metricool account (all your brands included) with Claude, and it reads your data directly.
Ask it anything you’d normally spend time digging through your dashboard for, and it pulls the numbers and writes the narrative for you. That means no more losing the last Friday of every month to reporting.
This guide shows you exactly how to set it up and the four prompts that build a complete client report.
What is Metricool’s MCP and Why it Matters for Reporting
Metricool’s MCP (Model Context Protocol) is the server that connects your Metricool account with Claude. Once it’s set up, Claude can:
- read your analytics and prepare reports on them
- check your best times to post
- schedule posts
- pull competitor performance data
You don’t even need to open the dashboard, just ask Claude whatever you need. Thanks to this direct connection, you won’t receive generic answers the AI guessed about your performance, and you’ll no longer need to copy and paste data into an AI. Claude reads your analytics, your scheduled posts, your competitor data, and more, directly.
How to Connect Metricool to Claude
The setup should take no longer than five minutes and you don’t need any experience with coding. These steps are for Claude.ai.
If you don’t have a Metricool account yet, create one for free. The connection works on every plan, including free*.
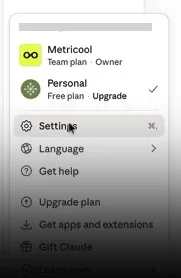
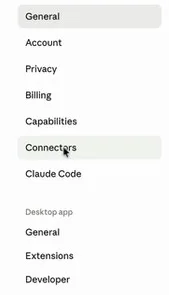
- Open Claude and click your profile icon in the bottom left corner, then go to Settings and from there to ‘Connectors’.
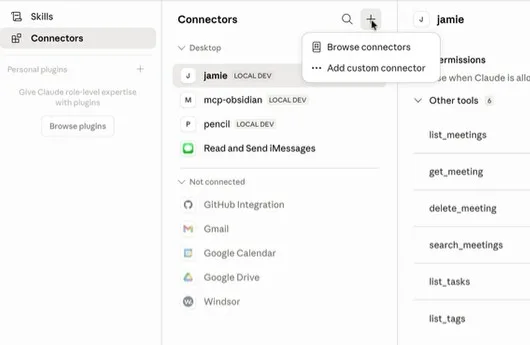
- Click ‘Go to Customize’. Next to ‘Connectors’, you’ll see a magnifying glass and a ‘+’ icon – tap the ‘+’ icon and click ‘Add custom connector’.
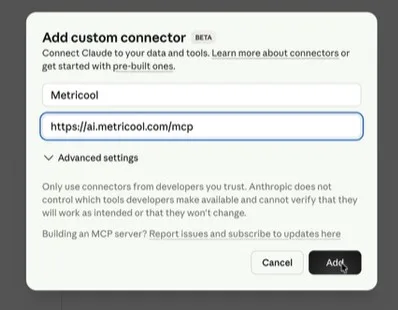
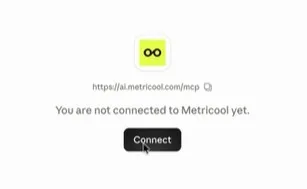
- A window will pop up. Add the name of your connector here (e.g. ‘Metricool’) and paste in the server URL: https://ai.metricool.com/mcp. Hit ‘Add’ when you’re ready.
- A Metricool login prompt will appear. Sign in and click ‘Grant access’.
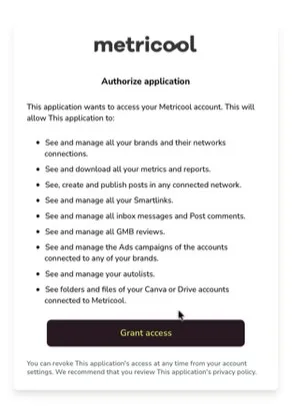
That’s it! All your Metricool brands are now accessible to Claude.
*Free plan users: the MCP connection works on all plans. The limitations that apply are those of your plan. For example, with the free account you cannot access data older than 3 months nor schedule more than 20 posts. Paid plans extend these limits.
The New Routine: 4 Prompts That Build a Complete Client Report
Once your connection is live, run these four prompts in sequence once a month. Each one feeds into the next, so by the end you have a full narrative report ready to share or lightly edit.
Prompt 1: Pull the core numbers
📝 “Give me the key performance metrics for [brand] across Instagram, LinkedIn, and TikTok for the last 30 days.”
What it returns: Follower growth, reach, impressions, engagement rate, and total posts published per network pulled directly from your Metricool data. Claude formats these into a clean summary table.
Adaptation tip: Replace the networks with whichever platforms your client uses. For e-commerce clients, add “and break out any link clicks or website traffic” to the prompt.
Prompt 2: Find what worked and why
📝 “Looking at [brand]’s posts from the last 30 days, which content performed best in terms of engagement and reach? What do the top posts have in common – format, topic, posting time, or tone?”
What it returns: A ranked breakdown of your top-performing posts with engagement numbers, plus Claude’s pattern analysis across format (Reel vs. carousel vs. static), topic category, and approximate posting window. This is the section clients actually read.
Adaptation tip: For video-heavy clients, add “and compare average watch time on Reels vs. TikTok” to push Claude to surface platform-specific insights. For B2B clients on LinkedIn, add “and note which post topics drove the most profile visits.”
Prompt 3: Compare against last month and flag trends
📝 “Compare [brand]’s engagement rate and reach from this month against last month. What are the biggest positive and negative changes, and what might explain them?”
What it returns: A month-over-month comparison with percentage deltas, plus Claude’s interpretation of the shifts — tying them to posting frequency changes, content mix, or external factors where it can infer them from the data.
Adaptation tip: If the brand runs paid campaigns alongside organic, add “separate paid and organic reach where possible” so the comparison is meaningful. For seasonal businesses, add “and note whether this aligns with expected seasonal patterns.”
Prompt 4: Write the client-facing summary
For this one, it’s best to upload a template and ask Claude to fill it out.
📝 “Based on the data from the previous prompts, fill in this report template and output it ready to share with a client. Use this structure:
- Executive summary (2–3 sentences on overall performance)
- Network-by-network breakdown (followers, reach, impressions, engagement rate, posts published)
- Top content this month (top 3 posts, what they had in common)
- Month-over-month comparison (key metric deltas and what explains them)
- What we learned (3–5 bullet points)
- Recommendation for next month (one specific, actionable suggestion)
Keep it clear, avoid jargon, and write it for a client who doesn’t live in dashboards.”
What it returns: A fully populated report, structured and ready to share. Claude fills in every section from the data it pulled in Prompts 1–3.
Adaptation tip: Add “write it in the voice of a strategic consultant, not a data analyst” if your client expects premium positioning. For retainer clients, add “and reference last month’s recommendation to show continuity.”
How to Schedule Report Automation
Using these four prompts once is helpful as it saves you tons of time. But let’s be honest, if you’re saving them in a document to copy and paste every month, you’re not really eliminating the work. You’re just making it slightly faster.
The key is to separate the system into two parts: the method and the client.
The method goes into a Skill
A Skill is a set of instructions you give Claude once. Whenever you ask for a report inside a client’s project, Claude will follow them automatically without you having to remind it. This is where you put everything that doesn’t change from one client to another:
- The four prompts in order
- The report structure
- The tone
- The rules for interpreting data
- What it should avoid
- Etc.
You write it once. And if you ever want to improve the process, you just update the Skill, and that change applies to all your clients automatically.
The client goes into a Project
A Project is a space inside Claude where you store the specific information for a brand. You create one per client and include everything Claude needs to know:
- Their social networks
- The metrics that matter most to that brand
- Their business goals
- Reports from previous months
- And anything else relevant
This way, Claude doesn’t start from scratch every time. It has the context, knows what was done before, can compare month to month, and maintains continuity without you having to explain it again in every report. This is what real automation looks like.
When the time comes to prepare the report, you open the client’s project and type a single message:
“Prepare the report for May.”
That’s it. The data comes directly from Metricool into your Claude conversation.
How to Create Your Reports Skill
Let’s see how you set up your reports Skill. Follow these steps inside Claude:
- Go to Customize
- Click on Create new skills (or go there directly)
- Next to the Skills section you’ll see a magnifying glass and a “+” icon, hit it.
- Click Create new skill. You’ll have three options:
- Create with Claude: start a conversation and tell Claude what you want the skill to do
- Write the skill instructions: give it a name, a description, and the instructions directly
- Upload a skill: if you already have a file with the instructions ready
In this case, you could go with Write the skill instructions, since you already have the four prompts. But if you’re unsure, Create with Claude lets you build it step by step together.
Once saved, Claude will follow the Skill automatically every time you ask for a report inside any client project.
How to Create a Project per Client
Go to Projects in Claude’s sidebar and click New project. Name it after the client and add their context: which networks you manage for them, which metrics matter most, whether they’re a seasonal business, whether they combine organic and paid content.
You can also paste in reports from previous months so Claude has continuity and can compare results without you having to explain the history every time.
Monthly Workflow for Multiple Clients
If you manage five or more brands, organize your reporting in blocks so you’re not constantly jumping between accounts.
The ideal time to prepare the report is on the first or second working day of the month. By then, the previous month’s data will be complete and fresh.
Also, if you always run reports on the same date, month-to-month comparisons will be cleaner because you’ll be analyzing similar time periods.
A workflow that works well: open the first client’s project, request the report, then move to the next. Once you have all the drafts, review them in one go.
That review is where you add the value AI can’t provide: the context of a campaign you launched, a strategy shift mid-month, or a recommendation that connects with what you’ve been testing over the past few weeks.
Automation handles gathering the data and producing the draft. Your job is to add the strategic layer on top. That’s where the real value of the report lies – for both you and your client.
FAQ
Do I need to know how to code to set this up?
No. The connection is made through Claude’s Connectors settings. You add a URL and click Grant Access. No coding or technical setup required.
Does it work for multiple brands and client accounts?
Yes. When you connect Metricool, all the brands in your Metricool account become accessible to Claude. You specify which brand in each prompt, so you can run reports for multiple clients from the same connection.
What plan do I need?
The MCP connection works on all Claude plans, including the free one, however, paid plans offer more capabilities.
How accurate is the data Claude pulls from Metricool?
Claude reads directly from your Metricool account via the MCP server, so the numbers are the same ones you’d see in your Metricool dashboard. There’s no scraping or estimation involved. The only caveat: platform APIs (Meta, TikTok, etc.) occasionally have a 24–48 hour reporting delay, which affects Metricool’s data as well as Claude’s.
Can I use this in Claude Desktop or Claude Code?
You can use it in Claude.ai (the web interface), Claude Desktop, Claude Code, or any Claude client that supports MCP connections. The setup steps above are for Claude.ai; for Desktop or Code, you’ll add the MCP server URL through the app’s settings or config file instead.
Is my client data safe?
The MCP connection gives Claude read access to your Metricool analytics; it doesn’t store your data or share it with third parties. For sensitive client accounts, review Anthropic’s and Metricool’s data handling policies before connecting. Claude.ai conversations are not used to train models by default on paid plans.
Smarter Social Media Management With Metricool’s MCP
Bring your analytics, scheduling, and reporting into one AI-powered workflow and spend less time switching between tools.
