

Ecommerce Social Media Marketing: What 72 Brands Post and What Works
 Gretchen Oestreicher
30 October 2026

Ecommerce social media marketing comes down to a handful of decisions: which networks get your time, how often you post, which formats you use, and what you say about your product. To see how brands make those calls, we analyzed 3,234 posts that 72 US ecommerce brands published in August 2026. We covered Instagram, TikTok, Facebook, and YouTube, and compared what the brands posted with the results each post got.
The brands span seven categories and include names like Bombas, Brooklinen, Owala, Kosas, and The Farmer’s Dog. There’s no Nike or Walmart in the group, so these are strategies that a smaller team can copy. Every figure comes from Metricool’s Social Media & Ecommerce Report 2026. The sample is small and handpicked, so treat the numbers as a benchmark from well-known online brands that a growing store can measure itself against.
What Ecommerce Social Media Marketing Covers
Ecommerce social media marketing is how an online store uses social networks to get products discovered, show them in use, and send people somewhere they can buy. It’s one part of ecommerce marketing, next to search, email, and paid ads, and it’s often the first place a shopper sees a product.
Social media for ecommerce works differently from social media for a service business. You have a physical product to show and a catalog that changes with every launch and season. And you often sell in several places, such as your own site and retail partners like Target or Costco. If you’re working out how to use social media for ecommerce, start with those three things, because each one shapes what you post and where you send people.
Ecommerce Statistics From 72 Brands on Social Media
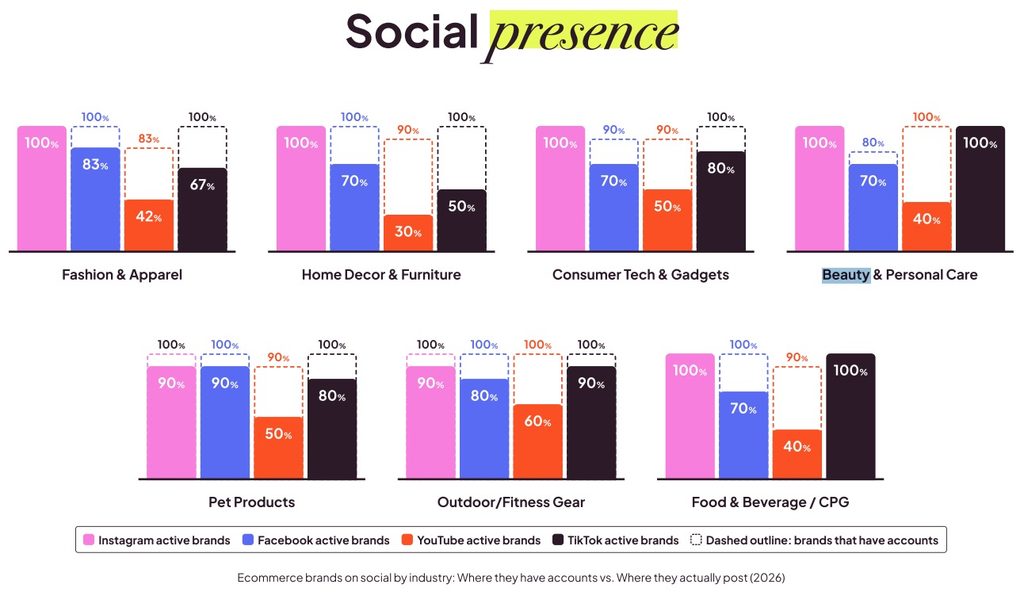
Almost every brand in the study has an account on all four networks, but far fewer post on all of them. The table shows how many brands posted at least once in August and what a typical post got on each platform.
| Platform | Brands that posted in August | Median interactions per post |
| 97% | 293 | |
| TikTok | 81% | 74 |
| 76% | 9 | |
| YouTube | 44% | 8 |
Interactions mean likes and comments on Instagram and YouTube, likes, comments, and shares on Facebook, and likes, comments, shares, and saves on TikTok. Each figure is a median, which means that if you line up every post from lowest to highest, it’s the one in the middle. That gives you a better picture of an ordinary post than an average, which a single viral post can inflate. TikTok figures leave out ads.
The low numbers on Facebook and YouTube come partly from how brands use them. Many brands repost their Instagram or TikTok content there with few changes, so those figures show what a recycled post gets. Content made for each platform could perform differently.
How to Build an Ecommerce Social Media Strategy
An ecommerce social media strategy is a set of decisions that you make once and revisit every few months. The brands in the study show what each decision looks like in practice, and where the data leaves room for your own judgment.
Pick One Network to Build Around
Most brands in the study give one network most of their effort and feed the others with adapted versions of the same content. That’s a realistic model for a small team, and for most brands, Instagram is the best place to start. It holds the largest combined audience in the study, close to 40 million followers. A typical post there gets more interactions than a typical post on TikTok, Facebook, and YouTube combined.
It isn’t the best place for every brand, though. Beauty gets more from a typical YouTube video than from an Instagram post, and Outdoor/Fitness Gear is the one category that gets a strong response on Facebook. Before you decide, look at where brands in your own category get the strongest reaction, and start there, even if it’s somewhere other than Instagram.
Give Each Other Network a Specific Job
Once your main network is running, add others only if they give you something it can’t, like a new audience. The brands in the study use each one differently, with mixed results:
- TikTok for Reaching New People: On TikTok, brands split their posts fairly evenly between new launches, product demos, and entertainment. A typical TikTok gets far fewer interactions than an Instagram post, so judge TikTok by the new viewers it brings in instead. Some brands appear there only through ads, so check how much of a competitor’s TikTok is organic before you benchmark against it.
- Facebook for Low-Effort Upkeep: Two in three Facebook captions repeat a caption from the same brand’s Instagram, and a typical Facebook post gets a small fraction of Instagram’s interactions. The data can’t separate the two possible causes, a smaller audience or recycled content, but effort and return stay low together. Reposting is fine if Facebook is a maintenance channel for you. If your customers spend time there, adapt the posts properly for a month and compare the results.
- YouTube for Shorts or One Committed Series: Most brands treat YouTube as another home for vertical video. Shorts make up 8 in 10 of their videos, and many are reposted from TikTok or Instagram. Long-form video takes more than consistency: Hatch published a podcast episode every day in August, yet a typical Consumer Tech video on YouTube got almost no interactions. A long-form series needs a plan for finding its audience before it needs a posting schedule.
Set a Posting Rhythm That Fits Your Catalog
Brands post on Instagram about four times a week, and every industry keeps a similar pace there. Across all four networks, posting volume follows how fast products change. Fashion and Beauty publish the most, since new products and seasons keep giving them reasons to post. Home Decor publishes the least, which fits a purchase that people take longer to decide on.
More posts don’t guarantee better results. Beauty posts often and gets the most interactions, while Pet brands post on Instagram more often than most industries and get the fewest per post. Set your rhythm by how many posts you can make worth stopping for. If your catalog changes every few weeks, that number is higher, because each release deserves its own moment. If your customers take weeks to decide, a slower rhythm matches how they shop.
Match the Format to What the Product Needs to Show
Short-form video is the first format brands reach for, especially on TikTok, where nearly every post is a video. Static posts still fill about half of Instagram and Facebook feeds, though, and carousels are a big reason why. They work like a mini catalog, with several products, colors, or details in one post.
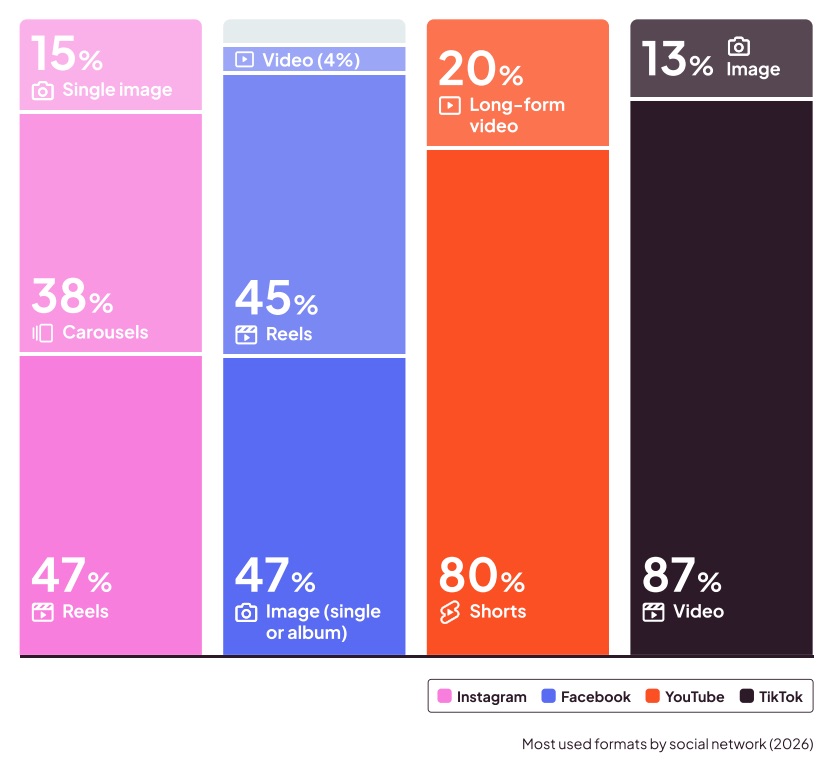
The study doesn’t compare how each format performs, so treat these patterns as habits to test against your own results. Brands in the study pick a format based on what they want:
- To Show How a Product Works: Video is the natural fit here, and categories with something to demonstrate, like Consumer Tech and Food & Beverage, post the most Reels.
- To Show Every Option: Carousels let you show sizes, colors, and details side by side. Fashion & Apparel uses them for more than half of its Instagram posts.
- To Show a Whole Room: A single image can carry a full scene. Home Decor & Furniture is the least video-driven industry, and two of its brands, Outer and Sixpenny, didn’t post a single Reel in August.
If a carousel shows your product better than a Reel, use the carousel, even on a feed where video leads.
Build Your Content Mix Around the Product
The product is the main character in ecommerce content. Launches and product-in-use posts make up over a third of what these brands publish, and product in use is the one content type that almost every brand posts.
That makes it hard to stand out with product posts alone, because your competitors are posting the same kind of content. Community posts and tutorials are a good way to be different. A community post asks a question, runs a poll, or invites people to tag a friend, and a tutorial shows people how to use the product. Nearly half the brands in the study didn’t publish a single community post in August, and nearly half didn’t publish a tutorial. Both content types perform slightly better than a brand’s usual posts, so adding them sets your feed apart and costs you nothing in engagement.
Sales and discount posts sit at the other end, as a small share of what brands publish and the content type that performs worst against a brand’s own average. A likely reason is that a discount asks for a purchase, while most posts in a feed are there to build interest. Save promotion for moments that need it, like a sale or a restock.
Let the caption follow the content type. Entertainment captions are short, often a single line, while launch captions run almost three times longer to make room for product details.
Decide Where Each Post Sends People
Within the same brand, posts with a call to action got about as many likes, comments, shares, and saves as posts without one. The study only measured those interactions, though, and a CTA’s job is to get people to click, visit, or buy. Adding a CTA doesn’t hurt a post’s engagement, and the place to judge it is your link clicks and website traffic. Use one whenever there’s somewhere useful to send people, like a launch date or a product page.
Write each CTA for the platform it runs on. On Facebook, you can put a clickable link right in the post, so a URL works better than “link in bio,” which only makes sense on Instagram. A few brands miss this. In the study, 32 Facebook posts still say “link in bio,” a sign that the caption was copied straight from Instagram.
Selling straight from social media, through retailer mentions or TikTok Shop, is a strategy of its own, known as social commerce.
Measure Each Content Type Against Your Own Average
The study judges each content type by comparing posts with their own brand’s usual results, which is the most useful way to read your own data. Use medians when you check your numbers, since one viral post can pull an average far from what an ordinary post gets. Pet brands show why. They collected more Instagram interactions than any other industry, yet a typical Pet post gets the fewest interactions in the study.
A single month is a short window, and seasonal launches can shape any one of them. Track your own numbers over several months before you cut a content type. Read competitors the same way, against their own usual results, before you copy a post that looks like a hit.
Ecommerce Content Ideas From Top-Performing Posts
These ecommerce content ideas come from posts that performed well above their brand’s usual results in August, and from the content types that most brands leave out. Some product post ideas worth testing:
- Launch Countdowns: Before its Disney x BÉIS launch, BÉIS posted nine TikTok teasers with the date and time over five days. They reached about five times the views of its other posts. A Disney collab brings its own audience, so expect a smaller lift for a regular launch, but a dated countdown gives any release a fixed moment to build toward.
- One-Line Launch Posts: BÉIS posted a launch announcement with a single line of copy on Instagram, Facebook, and TikTok. It drew more than 114,000 interactions on Instagram alone.
- Mini Catalog Carousels: Owala’s product carousel was one of the month’s standout posts. Give each slide one color, size, or feature, and use the first slide to show the full range.
- Entertainment for Your Audience: Several of the month’s standout pet posts, from Ollie, Alpha Paw, and PrettyLitter, are entertainment posts. Pick a format that your audience already enjoys and keep the brand easy to recognize in it.
- Tutorials and Recipes: Food & Beverage brands publish more tutorials than any other industry, about 15% of their posts. A recipe, a setup guide, or a care routine shows the product at work and gives people something to come back to.
- Community Posts: Ask a question, invite people to tag a friend, or run a giveaway. Outdoor/Fitness brands favor this kind of invitation and use it in about 1 in 8 of their captions.
- Customer Content: Brands share about three times more posts from influencers and creators than from their own customers. Reviews, unboxings, and customer photos give you content that few competitors are posting. Collecting it takes a process, such as asking buyers for photos after delivery, which is likely why so few brands do it.
Ecommerce Social Media Marketing by Industry
Each of the seven industries has its own pattern, and the order below follows what a typical Instagram post gets in each one.
Beauty & Personal Care
Beauty brands get more interactions per post than any other industry on Instagram and TikTok. The lead comes from the whole category, since most Beauty brands sit above the overall Instagram median. A typical Beauty post on Instagram gets almost four times what a typical post in the study gets. Their feeds split almost evenly between new launches and the product in use, so followers see what’s new and how it looks on skin in the same week. If you sell something that people use on themselves, that pairing is the part to copy.
Outdoor/Fitness Gear
Outdoor/Fitness Gear builds its feed around launches more than any other industry, with almost 4 in 10 posts about new products. Gear gives brands plenty of reasons to announce something, such as a new colorway or a seasonal release. The category comes second only to Beauty for interactions on Instagram and TikTok. If your product comes in new versions often, each version is a reason to post.
Fashion & Apparel
Fashion posts on Facebook as often as on Instagram, and that’s where its effort and its results come apart. A typical Fashion post gets close to a hundred times more interactions on Instagram, so a Fashion brand short on time can scale back Facebook first. On Instagram, Fashion leans on launches and lifestyle posts, the kind of content that shows how a piece fits into someone’s day.
Consumer Tech & Gadgets
Consumer Tech posts less on Instagram than any other industry, and its strongest reaction comes from an unexpected place. The category collected most of the study’s Facebook interactions, even though an ordinary post there gets very little, which points to a few posts that spread widely. Its feed leans on entertainment, though much of that comes from Hatch’s daily podcast. For a tech brand, the takeaway is to check where your audience already reacts before you split your effort evenly across networks.
Food & Beverage / CPG
Food & Beverage has the biggest audience in the study on Instagram and TikTok, yet a typical post gets fewer interactions than in most other industries. Beauty has fewer Instagram followers and gets almost seven times more per post, which shows that engagement depends on more than audience size. Food leans on entertainment and trends more than on launches, a reasonable fit for products that people buy again and again.
Home Decor & Furniture
Home Decor publishes more lifestyle content than any other industry, with posts that show a piece inside a finished room. Together with product-in-use posts, that’s almost half of its feed, and it matches how people shop for furniture, since they want to picture it in their own home first. The category is the least active on TikTok and YouTube, so a home brand that posts there has fewer peers competing for the same attention.
Pet Products
Pet brands post fewer launches than any other industry and lean on entertainment instead, which makes up more than a third of their feed. Products like food or litter don’t change often, so the animals carry the content. If you sell a repeat-purchase product, entertainment gives you something new to post when the catalog stays the same.
Manage Ecommerce Social Media With Metricool
When one person runs four networks, the main account gets the attention and the others go quiet until someone remembers them. Metricool brings all of them into one place:
- Publishing to Several Networks: Upload a post once, choose the networks, and adjust each version before it goes out, including a call to action that fits each platform.
- Scheduling Ahead: Plan weeks in advance and see every network in one calendar, so the quieter accounts stay active.
- Competitor Reports With Metricool Studio: Ask a question about the brands in your space, such as which competitor posts got the most interactions last month. Metricool Studio builds the report from your Metricool data, with charts and a link that you can share.
Where to Start With Your Ecommerce Social Media Plan
Most of the brands in this study run social media in a similar way. They build their feeds around the product, put most of their effort into Instagram, and repost to other networks with few changes. That approach keeps every account active with a small team, and it leaves room for a brand that plans each network a little more carefully.
To build your own plan, start with the network where brands in your category get the strongest response. Make product posts the base of your feed, and post as often as you have something new to show. Add a community post or a tutorial each week, since many competitors skip them. Adapt each post and its call to action before it goes to a second network. Then check each content type against your own median every month, and give any change a few months before you decide to keep it.
Find Out Which Posts Work for You
See which posts get the most interactions on every network, all in one Metricool dashboard.
