



Engagement Rate Versus Reach: What Data Science Teaches Online Marketers
 Gretchen Oestreicher
17 November 2026
You post a Reel for a client and it takes off, reaching three times more people than anything else on the account. Then the client asks why the engagement rate dropped.
It happens the other way around too. A carousel collects thoughtful comments and saves but barely reaches anyone beyond your followers. It can feel like you have to choose between going viral and building a community.
Reach and engagement rate are closely linked, and once you see how, your stats get much easier to read and explain to clients.

Reach vs. Engagement Rate: What’s the Difference?
Reach is the number of unique accounts that saw your post. If one person sees it three times, that still counts as one. Impressions count every view, repeats included.
Engagement rate shows what share of those people (or of your followers) interacted with the post through likes, comments, shares, saves, or clicks.
Reach tells you how far a post traveled. Engagement rate tells you how much it resonated.
How to Calculate Engagement Rate
Two common formulas give different results for the same post.
Engagement Rate by Reach
Formula: (Total interactions ÷ Reach) × 100. Interactions usually means likes + comments + shares + saves.
Example: A Reel reaches 20,000 people and gets 1,000 interactions. 1,000 ÷ 20,000 × 100 = 5% engagement rate by reach.
Use this one to judge how a single post performed with the people who actually saw it.
Engagement Rate by Followers
Formula: (Total interactions ÷ Followers) × 100.
Example: The same Reel, on an account with 10,000 followers. 1,000 ÷ 10,000 × 100 = 10% engagement rate by followers.
This version is useful for tracking your account over time or comparing it with similar accounts. It ignores reach, though, so a post seen by 500 people and one seen by 50,000 get measured against the same follower count.
Use the reach-based rate for individual posts and the follower-based rate for account trends.
Why Engagement Rate Drops When Reach Goes Up
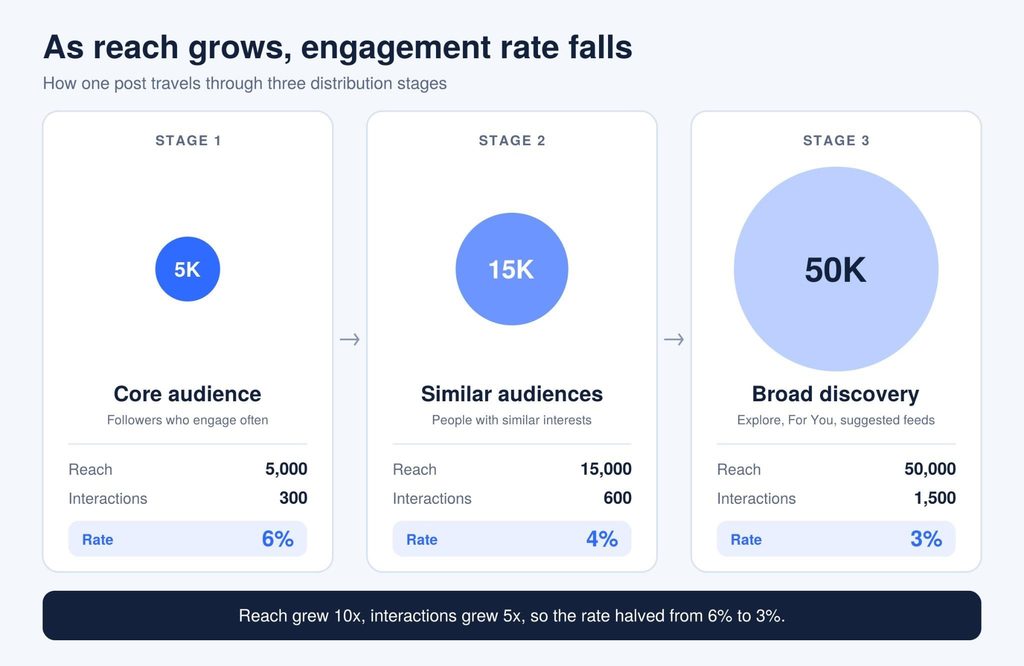
A lower rate on a high-reach post is normal, and it usually means the post is reaching new people. Most platforms distribute content in stages:
- Your core audience: The platform first shows your post to a small group of followers who engage with you often, so the rate is at its highest.
- Similar audiences: If that group responds, the post moves to people with similar interests who don’t know you yet, and fewer of them interact.
- Broad discovery: Finally, the post reaches people scrolling Explore, For You, and suggested feeds. Many see it for a moment and keep going, so the rate falls further.
In the formula, reach is the denominator, and it grows much faster than interactions as a post moves into discovery feeds. A post with 300 interactions from 5,000 people has a 6% rate. If it goes on to reach 50,000 people and collects 1,500 interactions, the rate falls to 3%, even though interactions grew five times over.
What Data Science Teaches Us About Reach
Reach on its own can look impressive without moving any business results. Data science gets past that by asking who you reached and what they did next.
- Count the people who stayed. Impressions include everyone who scrolled past. Effective reach only counts viewers who stayed past a cutoff, commonly the first three seconds of a video.
- Reach the right people. Platforms learn who your content is for from the people who engage with it. A burst of broad, untargeted reach can blur that signal and make it harder to reach your target audience later.
- Look for close-knit communities. Content travels further through tight groups where people know and trust each other, like niche communities and group chats. A post that lands in one of these groups often gets shared more than one pushed to a broad audience.
- Follow reach to results. Check high-reach posts against profile visits, link clicks, and website traffic. If the extra exposure brings visitors who leave right away, it isn’t doing much for your goals.
If you want to go deeper into the statistics behind these ideas, Research.com’s ranking of affordable online master’s programs in data science is a good place to start.
Not All Engagement Is Equal
A like takes a second. Saving or sharing a post takes more intent, so a single overall engagement rate can hide what’s really working.
- Likes: Quick, low-effort approval.
- Comments: A sign the post started a conversation. Longer, positive comments point to an audience that’s likely to stick around.
- Saves: The post was useful enough to come back to, which often signals interest in buying later on.
- Shares and sends: Someone is recommending you to a friend. Many of these happen in private messages (dark social), so they’re easy to miss.
If your goal is trust or sales, saves and shares usually tell you more than likes.
What Metricool’s 2026 Instagram Study Shows
Metricool looked at more than 24.3 million Instagram posts from 375,118 accounts, comparing January and February 2025 with the same months in 2026. We found two things that show how different formats get different kinds of participation:
- Reels got more than four times as many interactions as single-image posts.
- Carousels got nine times as many saves as single-image posts.
Reels are better at getting people to discover and interact with your content, while carousels give them something worth saving. If you only look at one overall engagement rate, you won’t be able to tell which format is best for the job.
Source: Metricool, 2026 Instagram Study and its press release (June 16, 2026).
Reach vs. Engagement by Platform
Each platform rewards different actions, so the signals worth tracking change depending on where you post.
Carousels and educational posts tend to collect saves and shares, while Reels depend more on watch time and replays. Use Reels to reach new people and carousels to deepen engagement with your current audience, and watch your saves-to-reach ratio.
TikTok
Reach swings a lot from video to video, so engagement rate by reach is far more useful than the follower-based version. How people watch matters most, whether they finish the video, drop off early, or watch it again, so track completion rate and average watch time.
Comments, reposts, and reading time usually carry more weight than reactions, so a small audience that comments in depth can outperform a large one that scrolls past. Before comparing numbers, check whether your tool calculates engagement with reach or impressions.
Facebook Reels work a lot like Instagram and TikTok: shares and comments that start a conversation count for more than quick likes. Keep an eye on views, shares, comments, and average watch time on your videos.
X and YouTube
On X, replies, reposts, and profile clicks drive the conversation and are the clearest sign a post landed. On YouTube, average view duration, audience retention, and thumbnail click-through rate show whether people chose your video and stayed with it.
Compare each network only against its own past results. If you post on multiple social media platforms, adapt each version to the format that network rewards.
How to Read Your Own Data
- Track your saves-to-reach ratio. Divide saves by reach to find the posts people found genuinely useful, even when overall engagement looks average. A post that reached 10,000 people and got 200 saves has a 2% ratio.
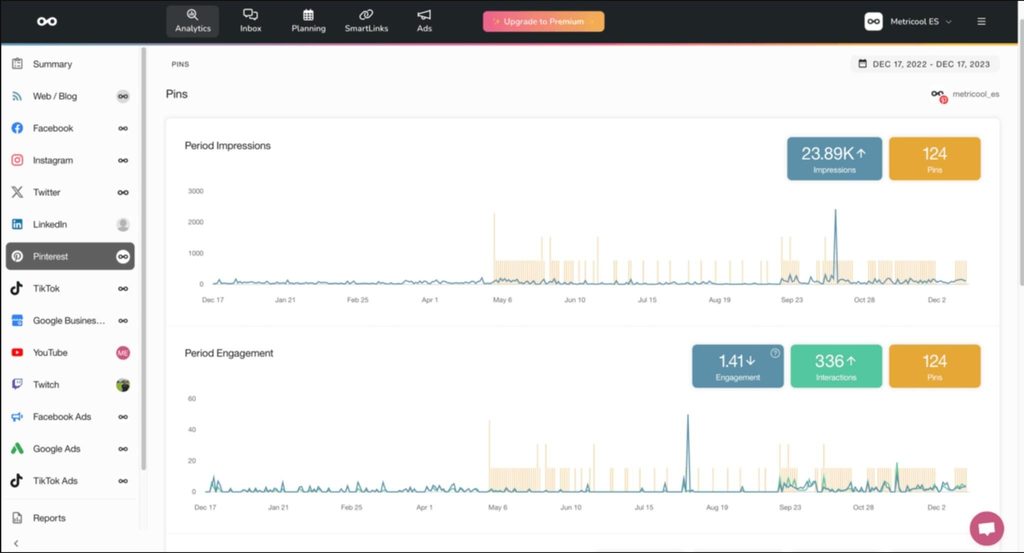
- Sort your posts by engagement rate. Pull your posts from the last 30 to 60 days and compare the top five with the bottom five. Look for a topic, format, or hook the best performers share. In Metricool, you can do this from the Analytics section.
- Read reach and engagement rate together. A high-reach post with a low rate isn’t a miss if it drove saves, shares, or clicks. A low-reach post with a high rate is a good candidate to repost as a short video or to turn into a small social media advertising campaign.
- Match the format to the goal. Short videos are easier to discover, while carousels and longer posts give people more to save and discuss. Compare carousels with carousels and Reels with Reels.
- Read the comments themselves. Sentiment matters as much as volume, and a spike in negative comments on a big campaign is worth catching early.
Metricool brings reach, engagement, and interactions for all your networks into one dashboard, so you can spot these patterns without building spreadsheets.
How to Explain a Lower Engagement Rate to a Client

Try wording it like this:
“This post reached far more people than usual, including a lot of people who don’t follow us yet. Total interactions went up, but the percentage dropped because the audience was so much bigger. It means we’re reaching new people, which is exactly what we want.”
Then back it up with the numbers that matter for their goals: clicks, shares, saves, and new followers.
TikTok Marketing Guide FAQs
Which Matters More for ROI, Reach or Engagement Rate?
You need both. Reach brings new people into the top of your funnel, and engagement rate shows how interested they are and how ready they might be to buy.
How Can You Improve Reach and Engagement at the Same Time?
Create content people want to save or share. Strong interaction signals give platforms the confidence to show your posts to larger audiences that still match your target.