Social Media Analytics with Metricool
 Gretchen Oestreicher
04 June 2025
Gretchen Oestreicher
04 June 2025 
Looking for a simple way to track how all your social media channels are doing without jumping between different platforms? With Metricool, you get detailed analytics for everything from Facebook and Instagram to TikTok, LinkedIn, Threads, Meta Ads, and more. Whether you’re focused on community growth, content performance, or audience insights, Metricool brings all your data into one clear dashboard so you can make smarter decisions for your strategy.
Let’s walk through what you can track on each platform.
Brand Summary with Metricool
Managing multiple platforms can get overwhelming fast. Metricool’s Brand Summary pulls all your key data into one place—so you can quickly see what’s working, where your audience is growing, and which platforms are bringing the most visibility and engagement.
Instead of bouncing between tabs or exporting reports from different networks, everything is laid out side by side. It’s a clean, visual way to compare performance across channels and understand your brand’s reach at a glance.
Brand Followers
See how your audience is growing across all platforms:
- Total Followers: A combined total of all your followers from every connected account.
- By Platform: Compare follower counts across Instagram, TikTok, Facebook, LinkedIn, YouTube, and more to spot where your audience is most engaged.
Brand Impressions
Check how much visibility your brand is getting:
- Total Impressions: The full reach of your brand across every platform.
- Impressions by Platform: A side-by-side view of each platform’s performance so you can quickly identify where your content is getting seen the most.
Brand Interactions
Measure how people are engaging with your posts:
- Total Interactions: A roll-up of all likes, comments, shares, saves, and other engagement actions.
- Platform Comparison: Break it down by network to see which platform is driving the highest engagement.
Posts Published
Stay on top of your publishing schedule:
- Total Posts: See how much content you’ve pushed out across all channels.
- By Platform: Compare how active you are on each network.
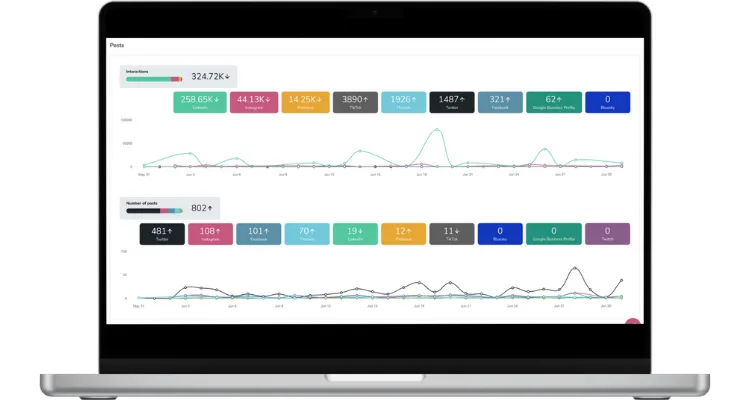
Post Performance
Go deeper into the details of your content:
- Post List: A full list of your published content, with info on platform, publish date, total impressions, and interactions making it easy to see what performed best.
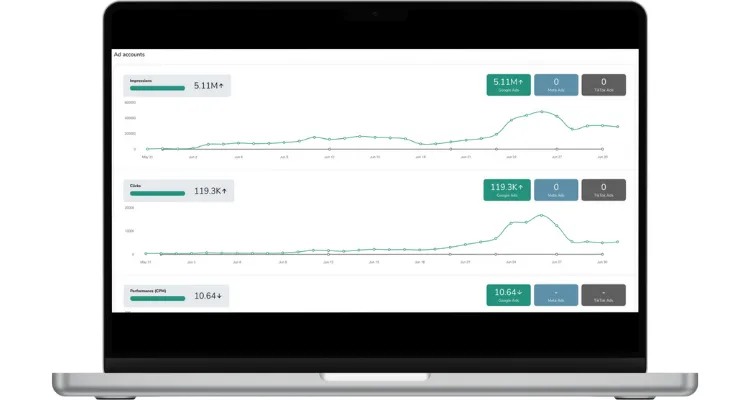
Ad Campaigns
Track your paid performance across channels in one place:
- Overall Campaign Metrics: Total impressions, clicks, CPM, CPC, and spend for your paid content.
- By Platform: See how your Google, Meta, and TikTok campaigns stack up, side by side.
- Campaign Breakdown: For every campaign, view the name, network, last updated date, impressions, clicks, CPM, CPC, and total spend.
With everything in one dashboard, you don’t have to guess what’s working. Metricool gives you a complete, easy-to-read snapshot so you can focus your energy on the platforms that are delivering results.
Facebook Analytics
Want to get a full picture of how your Facebook page is performing? Metricool gives you a detailed breakdown of your content, audience, and engagement so you know what’s working and what needs adjusting.
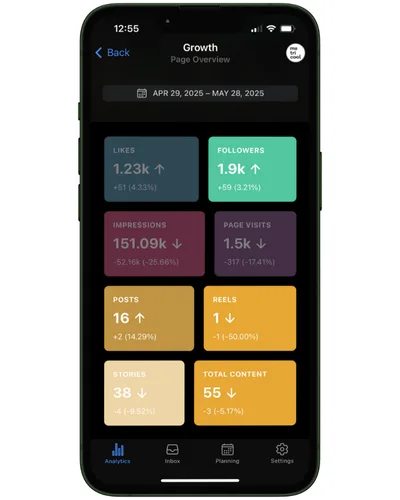
Page Overview
Start with a snapshot of your page’s performance.
Here, you’ll find:
- Growth: Track how your page is growing over time. You can view your number of likes, followers, impressions, page visits, and how much content you’ve published.
- Averages: Get daily and weekly averages for key metrics, including likes, post engagement, and page visits.
- Balance of Likes: See how many likes you gained and lost during the selected period, alongside the number of posts published.
- Posts Viewed: Find out how your content performed with total impressions and reactions during the selected timeframe.
Audience Demographics
Understand who your audience is:
- Reach broken down by gender and age
- Follower distribution by country and language
Click Activity
Want to know how many people are taking action on your page?
- Total page clicks
- Number of page visits
- How much content was posted during the period
Content Performance
A clearer look at how your Facebook posts performed during the selected timeframe:
- Overview: Engagement, interactions, average reach per post, and total impressions.
- Interactions: Breaks down reactions, comments, shares, and clicks per post.
- Averages: View engagement trends with daily and per-post averages for reactions, comments, and shares.
- Content Types: See what kinds of posts you published (organic vs. promoted) and how each type performed in terms of impressions.
Post-by-Post Breakdown
Get into the details of every Facebook post. For each one, Metricool shows:
- Post type and publish date
- Reactions, comments, shares, and link clicks
- Impressions and reach
- Video views and average watch time (if applicable)
- Engagement rate
- Ad spend (if it was a promoted post)
This section is perfect for reviewing your content strategy, comparing post formats, and planning your next moves.
Instagram Analytics
Want to know how your Instagram profile is performing? Whether you’re focusing on posts, Stories, Reels, or your community growth, Metricool gives you all the numbers in one place. Let’s break it down.
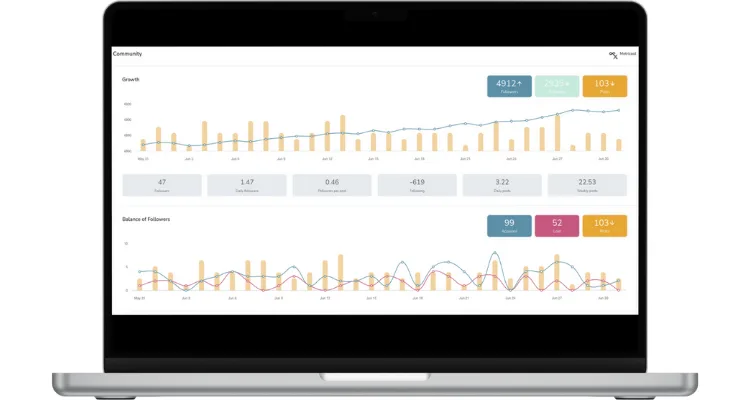
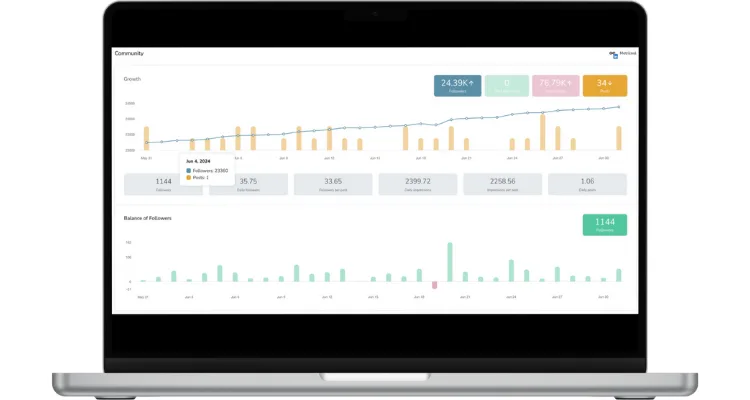
Community Growth
Keep track of how your audience is growing and how active you’ve been over time:
- Followers and Following: Total followers, accounts you follow, and content published.
- Growth Over Time: See how many followers you’ve gained during the selected period, average daily followers, and how many new accounts you followed.
- Posting Habits: View your average number of posts per day and per week.
- Follower Balance: Visual breakdown of how your follower count has evolved during the period.
Audience Demographics
Understand who’s following you:
- Gender distribution
- Where your followers are located (country and city level)
Account Performance
Gauge how people are interacting with your profile overall:
- Profile Activity: Profile views, average reach per post, and total content posted.
- Clicks From Profile: See how many users clicked to email, call, get directions, or send a message—plus the total click count.
- Content Carousel: Scroll through the content you posted during the selected timeframe.
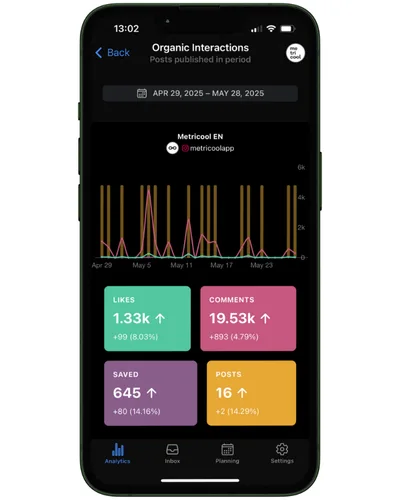
Organic Post Performance
Get detailed insights into how your posts performed without paid promotion:
- Summary: Overall engagement, total interactions, average reach per post, views, and number of posts.
- Interactions: Likes, comments, saves, shares—all broken down by total and post count.
- Averages: Daily likes and comments, per-post averages, and a likes-per-comment ratio to help you assess engagement quality.
- Content Type: Breakdown of post types (carousel vs. image) and how each one performed.
- Views: See the difference between organic and paid views at a glance.
Individual Post Breakdown
Metricool gives you all the details for each post you published:
- Type of post and publish date
- Organic views, paid impressions, organic and paid reach
- Likes, comments, saves, shares (all organic)
- Total interactions and engagement (organic and paid)
- Paid post clicks and ad spend, if applicable
Hashtag Performance
See how your hashtags are performing across your content:
- Views per hashtag
- Number of posts where each hashtag was used
- Total likes and comments on posts using that hashtag
Instagram Reels Analytics
Short-form video is a huge part of Instagram, and Metricool tracks it all for you.
Reels Overview
- Engagement, total interactions, views, and average reach per Reel
- Number of Reels published in the selected period
Interactions
- Likes, comments, saves, and shares—all specific to Reels
- Total number of Reels posted in the timeframe
Individual Reels Breakdown
See detailed analytics for each Reel:
- Publish date
- Organic views, paid views, and paid reach
- Engagement details: likes, comments, saves, shares (all organic)
- Paid interactions, post clicks, and ad spend if applicable
Instagram Stories Analytics
Metricool tracks your Instagram Stories so you know how your audience is interacting with them.
Story Performance Over Time
- Evolution of impressions
- Average reach per Story
- Total Stories posted during the period
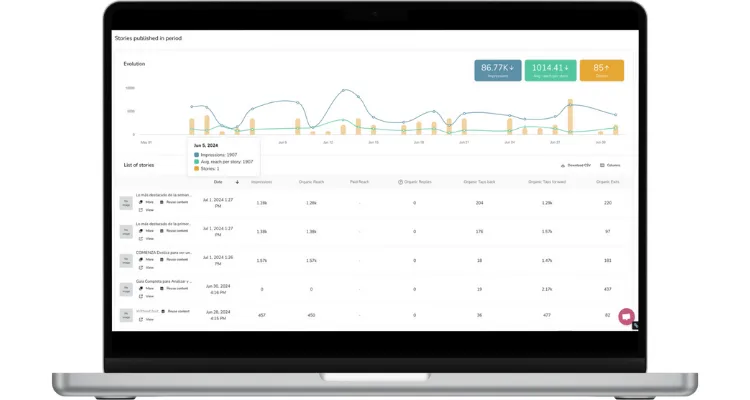
Story-by-Story Data
Each Story includes:
- Date published
- Impressions, organic and paid reach
- Replies, taps back, taps forward (organic)
- Story exits (organic)
Instagram Competitor Analysis
Keep an eye on what others in your niche are doing.
Metricool shows:
- A list of competitors with total followers, total posts and Reels published, likes, comments, and engagement
- Click into each competitor to see deeper insights:
- Community growth
- Number of posts and interactions during a selected period
- List of individual posts with detailed stats: likes, comments, total interactions, and engagement
- Reels data with organic performance breakdown
Threads Analytics
Threads by Meta is picking up momentum, and now you can track your performance directly from Metricool. From follower growth to post engagement, all the data you need is right here.
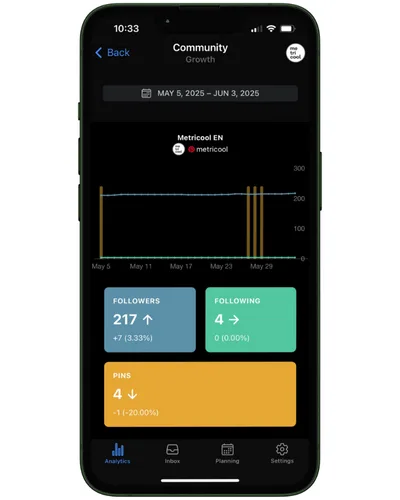
Community Growth
Get a clear view of how your Threads profile is growing:
- Followers and Posts: Total number of followers and posts published.
- Activity Averages: Daily follower growth, followers gained per post, daily posting habits, and weekly post count.
- Follower Balance: See how your follower count changes over time, with easy-to-read visuals.
Audience Demographics
Understand who’s engaging with your content:
- Breakdown by gender and age
- Where your followers are located (country and city)
Post Performance
Track how your Threads content performs over time:
- Summary: Total engagement, number of interactions, impressions, and posts published during the selected period.
- Interactions: See how users are responding to your content with likes, replies, reposts, and quotes—all tied to your post count.
- Content Types: Breakdown of the types of posts you’ve published, including text posts, reposts, videos, images, and carousels.
Individual Post Stats
Review each post with all the details:
- Post type and publish date
- Impressions
- Number of likes, replies, reposts, and quotes
Whether you’re building a new audience on Threads or testing content formats, Metricool helps you keep track of it all.
X (Twitter) Analytics
With changes to the X (Twitter) API, analytics are now available as an add-on for Metricool Premium users. If X is part of your social strategy, you can still track your performance in detail with the available metrics inside Metricool.
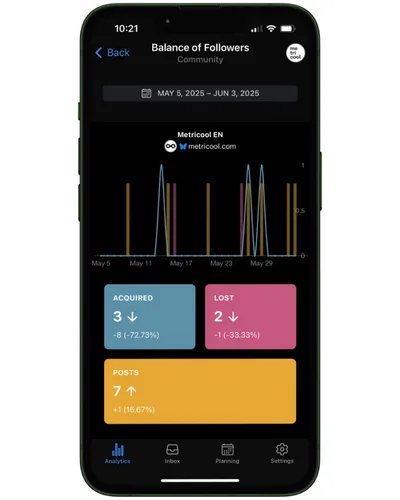
Community Growth
Keep tabs on how your audience is evolving:
- Followers and Following: Total number of followers, accounts you follow, and posts published.
- Growth Over Time: See how many followers you gained, your average daily growth, and how many new followers you earned per post.
- Following Activity: Track how many accounts you followed or unfollowed over the selected period.
- Posting Habits: Get your average number of posts per day and per week.
- Follower Balance: Visual breakdown of followers gained and lost, along with how much content you posted.
Follower Acquisition
Go deeper into who’s following and unfollowing you:
- See a list of users who followed or unfollowed you during the selected period
- For each user, you’ll see their follower count, whether they follow you back, and a quick-follow button right from the Metricool dashboard
Post Performance
Everything you need to know about how your content is performing on X:
- Summary: Overall engagement, impressions, interactions, and number of posts published.
- Interactions: Likes, reposts, replies, quotes, link clicks, and profile clicks—all tied to post count.
- Post Types: Breakdown of content formats: original tweets, reposts, and replies.
- Impressions: See the difference between paid and organic reach for a clear view of your strategy’s reach.
Individual Post Analytics
Metricool gives you a detailed view of each X post:
- Date published
- Impressions
- Likes, reposts, replies, quotes
- Link clicks and profile clicks
- Engagement metrics and video views (if applicable)
With these insights, you’ll have a better handle on what type of content works best and where to focus your efforts moving forward.
Bluesky Analytics
Bluesky is one of the latest platforms to enter the social space and now you can track your growth there too. With Metricool, Bluesky analytics are part of your full social media picture.
Community Growth
See how your Bluesky profile is growing over time:
- Followers and Following: Total number of followers, accounts you follow, and posts you’ve published.
- Posting Averages: Your daily and weekly posting trends.
- Follower Balance: View how many followers you’ve gained or lost during a selected period, alongside your posting activity.
- Follower Insights: A list of users who followed or unfollowed you, along with their own follower count for added context.
Post Performance
Measure the reach and engagement of your Bluesky content:
- Summary: Total interactions and posts published during the selected period.
- Interactions: Likes, replies, reposts, and quotes.
- Engagement Averages: Daily likes, likes per post, daily reposts, and reposts per post.
Post Breakdown
A full list of your content performance, post by post:
- Type of post
- Date posted
- Likes, replies, reposts, and quotes
Competitor Tracking
Keep an eye on what others in your space are doing:
- See a list of competitors with their follower count, number of accounts followed, and total posts published
If Bluesky is part of your strategy, Metricool helps you stay on top of your performance without juggling another tool.
LinkedIn Analytics
If LinkedIn is part of your marketing mix, Metricool gives you the stats you need to understand how your content performs and how your audience grows over time.
Community Growth
Track how your LinkedIn presence is developing:
- Followers and Impressions: Total followers, paid followers, impressions, and posts published.
- Growth Over Time: Followers gained during the selected period, average daily growth, and how many followers you gained per post.
- Impressions and Posting Trends: Daily impressions, impressions per post, and your average number of posts per day.
- Follower Balance: View followers gained and lost, along with how much content was published during that time.
Post Performance
Monitor engagement and interaction across your LinkedIn content:
- Summary: Overall engagement, interactions, impressions, and posts published during the selected period.\
- Interactions: Reactions, comments, shares, and link clicks.
- Daily and Per Post Averages:
- Daily reactions and reactions per post
- Daily comments and comments per post
- Daily clicks and clicks per post
List of Posts
Drill down into the details of each individual LinkedIn post:
- Post date and type
- Reactions, comments, clicks, and shares
- Impressions and total engagement
- For video content: number of viewers, time watched, and average watch time
Metricool makes it easy to turn your LinkedIn data into actionable insights, all from one dashboard.
Pinterest Analytics
Pinterest may look simple on the surface, but there’s a lot happening behind the scenes. With Metricool, you can track your Pinterest performance in detail from audience growth to individual Pin performance.
Community Growth
See how your Pinterest presence evolves:
- Followers and Following: Total number of followers, accounts you follow, and Pins you’ve posted.
- Growth Over Time: Number of followers gained during a selected period, average daily growth, and followers gained per Pin.
- Following Activity: Number of new accounts followed, along with your daily and weekly posting habits.
- Follower Balance: Track followers gained and lost, plus how much content was published in the same time frame.
Pin Performance
Measure how your Pins are performing:
- Summary: Total impressions, engagement, and interactions for the selected period.
- Interaction Breakdown:
- Pin clicks
- Outbound clicks
- Pins saved
- Total Pins posted
Organic Pin Analytics
Get into the specifics of each Pin:
- Date posted
- Organic impressions
- Saves
- Pin clicks
- Outbound clicks
- Video views (if applicable)
- Average video watch time
With Metricool’s Pinterest analytics, you can easily track what’s working and adjust your strategy to keep the momentum going.
TikTok Analytics
TikTok may move fast, but Metricool helps you keep up. From follower growth to video performance, track your TikTok activity in detail.
Community Growth
Understand how your audience is growing:
- Followers and Posts: Total number of followers and published videos.
- Follower Balance: See how many followers you’ve gained or lost during a specific period.
- Demographics: Breakdown of followers by gender and country.
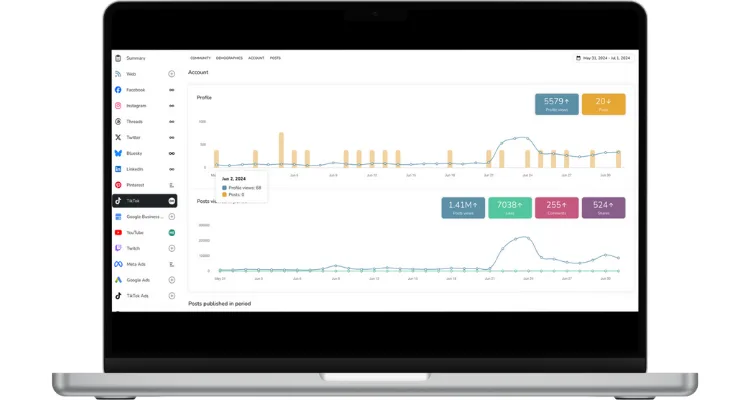
Account Activity
Track what’s happening on your profile:
- Profile Insights: Number of profile views and total content posted.
- Content Engagement: View counts, likes, comments, and shares during your selected period.
Post Performance
See how your videos perform over time:
- Summary: Total engagement, interactions, and average reach per post.
- Engagement Breakdown: Likes, comments, shares, and number of posts published.
- Impression Sources: Where your views are coming from — For You page, Following feed, search, or profile visits.
- Video Averages: Average watch time and duration for your videos.
- Post List: A detailed view of each video with type, date, views, likes, comments, shares, reach, duration, and engagement score.
YouTube Analytics
YouTube success doesn’t happen by accident. With Metricool, you get a full breakdown of your channel’s performance with every view, subscriber, and video.
Community Growth
Track how your YouTube presence is evolving:
- Subscribers and Views: Total subscribers, video views, revenue, and videos published.
- Subscriber Balance: Subscribers gained and lost during the selected period, plus videos published.
- Demographics: Gender and age breakdowns, along with views by country.
Traffic Sources
See how viewers are finding your content:
- YouTube search
- Suggested videos
- Shorts
- External links
- YouTube ads
Revenue
Monitor how your videos are generating income:
- Revenue Summary: Total revenue, partner revenue, and ad revenue.
- Monetized Videos: A list of monetized videos with the date published, total impressions, monetized playbacks, and earnings.
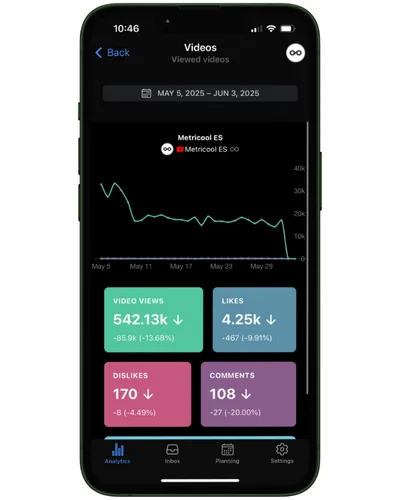
Video Performance
Understand how your content is landing with viewers:
- Overall Stats: Total video views, likes, dislikes, comments, shares, and videos published.
- Detailed List: For each video, see the date published, views, total watch time, average view duration, likes, dislikes, and comments.
Competitor Insights
See how your channel stacks up:
- Track other channels’ subscriber counts, views, published videos, likes, dislikes, and comments.
- Tap “More stats” to get a closer look at their video content and performance.
Twitch Analytics
Streaming on Twitch? Metricool helps you make sense of your growth, streams, and subscribers—all in one place.
Community Growth
Keep tabs on how your audience evolves:
- Followers, Following & Videos: Track your total followers, accounts you follow, and videos uploaded.
- Follower Balance: See how many followers you gained or lost during a selected period.
Subscribers
Take a closer look at your subscriber base:
- Subscriber Count: Total number of subscribers by tier, gifts received, and videos uploaded.
- Distribution Graph: Visual breakdown of subscriber tiers.
- Subscriber List: See who subscribed, when they joined, and what tier they’re in.
Streams
Monitor the performance of your content:
- Summary: Total views, total stream time, and videos posted in the selected period.
- Video List: Every individual stream with date posted, stream duration, and total views.
- Clips List: Each clip with date posted, the stream it came from, the game played, and view count.
Competitor Analytics
See how your channel compares:
- Competitor List: Overview of competitors’ follower counts, videos posted, clips published, and total views.
- More Stats View: Dive deeper into each competitor’s community growth (followers and videos), list of videos with dates, durations and views, plus list of clips with their games and total views.
Whether you’re just starting out or managing a growing Twitch channel, Metricool gives you the full picture to stay informed and keep improving.
Meta Ads Analytics
Running ads on Facebook or Instagram? Metricool gives you a clear breakdown of how your Meta ad campaigns are performing.
Ad Account Overview
Track your paid performance at a glance:
- Reach Metrics: Total impressions, reach, and ad spend during your selected period.
- Results: Number of clicks and total amount spent.
- Performance Stats: Get insights into your CPM (cost per thousand impressions), CPC (cost per click), CTR (click-through rate), and overall ad spend.
List of Campaigns
Dig into the details of each campaign:
- Campaign name
- Last updated
- Impressions and reach
- Clicks and conversions
- Results and conversion value
- CPM, CPC, CTR, and ROAS (return on ad spend)
- Total amount spent
With all your Meta Ads data organized in one place, it’s easier to see what’s working and make smarter decisions for future campaigns.
Google Ads Analytics
Keep your ad performance on track with a complete overview of your Google Ads campaigns, all from your Metricool dashboard.
Ad Account Overview
See the big picture for your account:
- Reach: Total impressions and how much you’ve spent during the selected period
- Results: Clicks and conversions
- Performance: Track your CPM, CPC, CTR, and total spend
- Revenue: Get a clear view of your conversion value and ROAS (return on ad spend)
Campaign Breakdown
Review each campaign’s results in detail:
- Campaign name
- Last updated
- Impressions, clicks, and conversions
- CPM, CPC, and CTR
- Conversion value, ROAS, and total spend
Keyword Performance
Find out which keywords are pulling their weight:
- Impressions
- Clicks and conversions
- CPM, CPC, CTR\
- Amount spent per keyword
With everything laid out clearly, you can quickly see what’s working and what needs a closer look—no more guessing.
TikTok Ads Analytics
If you’re running paid campaigns on TikTok, Metricool helps you keep tabs on performance without jumping between platforms.
Ad Account Overview
All your main metrics, right where you need them:
- Reach: Total impressions and how much you’ve spent
- Results: Clicks, conversions, and total cost
- Performance: Track CPM, CPC, CTR, and overall spend
Individual Campaign Breakdown
Check the results for each campaign:
- Campaign name
- Last updated
- Impressions, clicks, and conversions
- CPM, CPC, CTR
- Total cost
It’s everything you need to review your ad performance, spot trends, and adjust your strategy in a few clicks.
